Gold Trend 18/11

Home  Gold Trend 18/11


Gold Trend 18/11

2021-11-18 @ 13:58

Yesterday, gold recovered from the fall the day before. The market opened near day low around 1850 early in the Asian session and the price has continued to climb. At the US session, it reached the day-high near 1867. The day ended at 1867, up by USD 17.


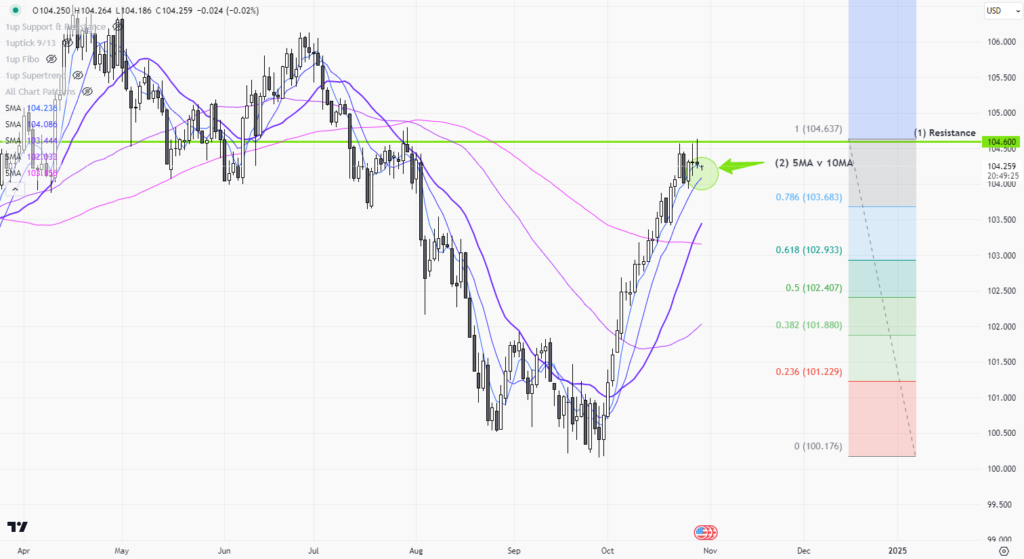
The pattern has changed much on the 1-hour chart in the last 24 hours. The price is still maintaining its path with the wedge pattern(1). No sign of it escaping the range any time soon, can continue to take advantage of the pattern(1).


The horizontal range 1848-68(2) is still valid. As mentioned yesterday, if the price is not able to escape the range within today, it will stay within 1848-68 for another 2-3 trading days.

S-T Resistances:

1880

1875

1868-70


Market price: 1865

S-T Supports:

1860-62

1855

1850


Risk Disclosure: Gold Bullion/Silver (“Bullion”) trading carries a high degree of risk, and may not be suitable for all investors. The high degree of leverage can work against you as well as for you. This article is for reference only and is not a solicitation or advice to trade any currencies and investment products . Before deciding to trade Bullion you should carefully consider your investment objectives, level of experience, and risk appetite. The possibility exists that you could sustain a loss of some or all of your initial investment or even more in extreme circumstances (such as Gapping underlying markets) and therefore, you should not invest money that you cannot afford to lose. You should be aware of all the risks associated with trading Bullion, and seek advice from an independent financial advisor if you require. Client should not make investment decision solely based on the point of view and information on this article. 


Tag:
Latest Technical Analysis
EURUSD-1 hour

EURUSD-1 hour

EURUSD-Daily

EURUSD-Daily

USDCAD-Daily

USDCAD-Daily

GBPUSD-Daily

GBPUSD-Daily

1 2 3 4 5 20
Latest Chart Pattern
AUDUSD 1d

AUDUSD 1d

DXY 1d

DXY 1d

CBOT Corn 1d

CBOT Corn 1d

1 2 3 4 5 14

1uptick Analytics @

Maximize your profit at ease

Risk Warning​

*Investment involves risk. You may use the information, strategies and trading signals on this website for academic and reference purposes at your own discretion. 1uptick cannot and does not guarantee that any current or future buy or sell comments and messages posted on this website/app will be profitable. Past performance is not necessarily indicative of future performance. It is impossible for 1uptick to make such guarantees and users should not make such assumptions. Readers should seek independent professional advice before executing a transaction. 1uptick will not solicit any subscribers or visitors to execute any transactions, and you are responsible for all executed transactions.

© 2022-25 – 1uptick Analytics all rights reserved.


Risk Warning​

*Investment involves risk. You may use the information, strategies and trading signals on this website for academic and reference purposes at your own discretion. 1uptick cannot and does not guarantee that any current or future buy or sell comments and messages posted on this website/app will be profitable. Past performance is not necessarily indicative of future performance. It is impossible for 1uptick to make such guarantees and users should not make such assumptions. Readers should seek independent professional advice before executing a transaction. 1uptick will not solicit any subscribers or visitors to execute any transactions, and you are responsible for all executed transactions.

© 1uptick Analytics all rights reserved.

Home
Analysis
Calendar
Tools
Signals