 |
| Gold V.1.3.1 signal Telegram Channel (English) |
Gold Trend 27/01
2022-01-27 @ 16:42
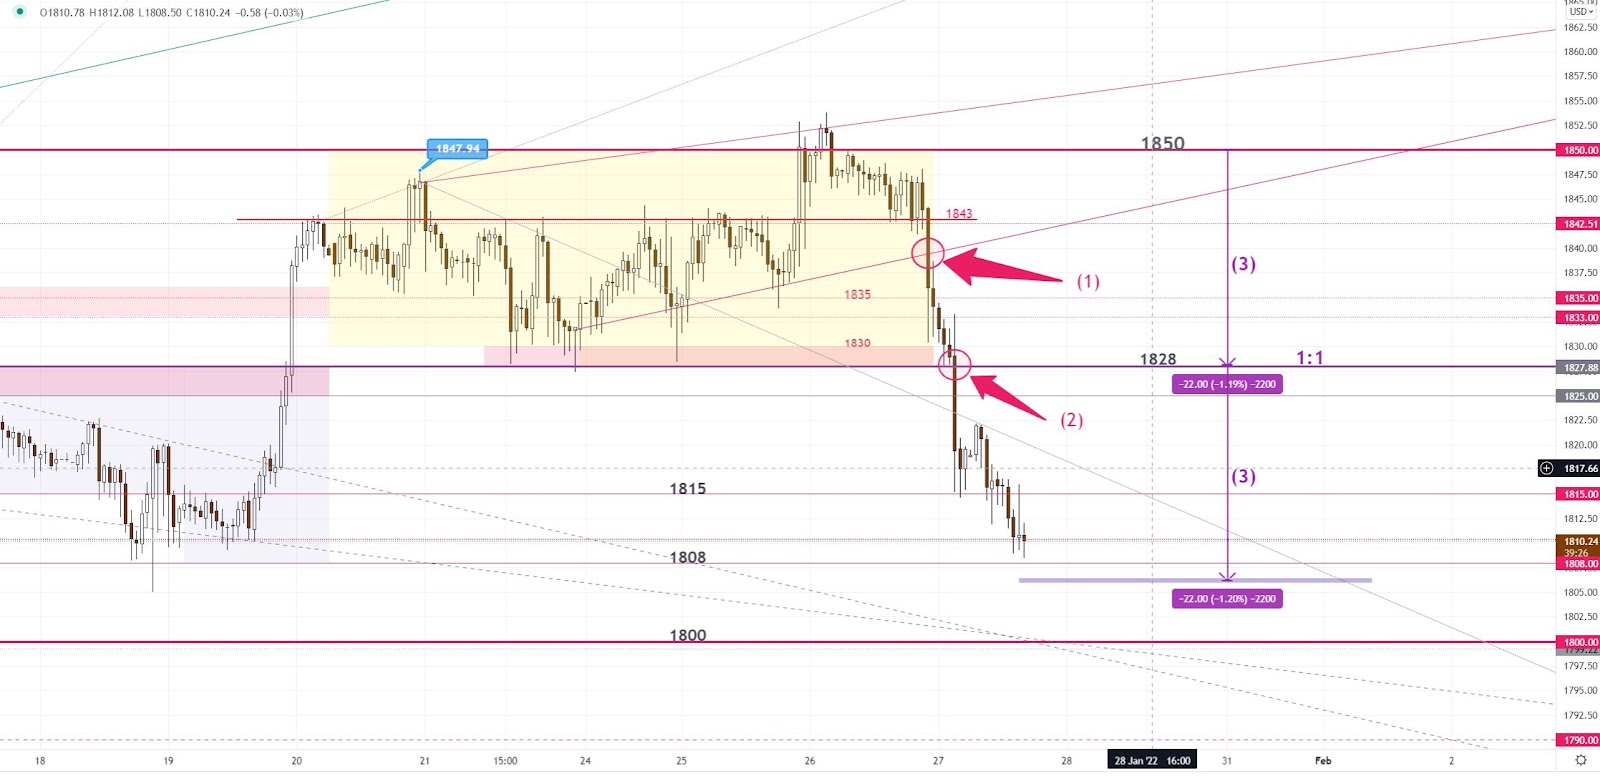
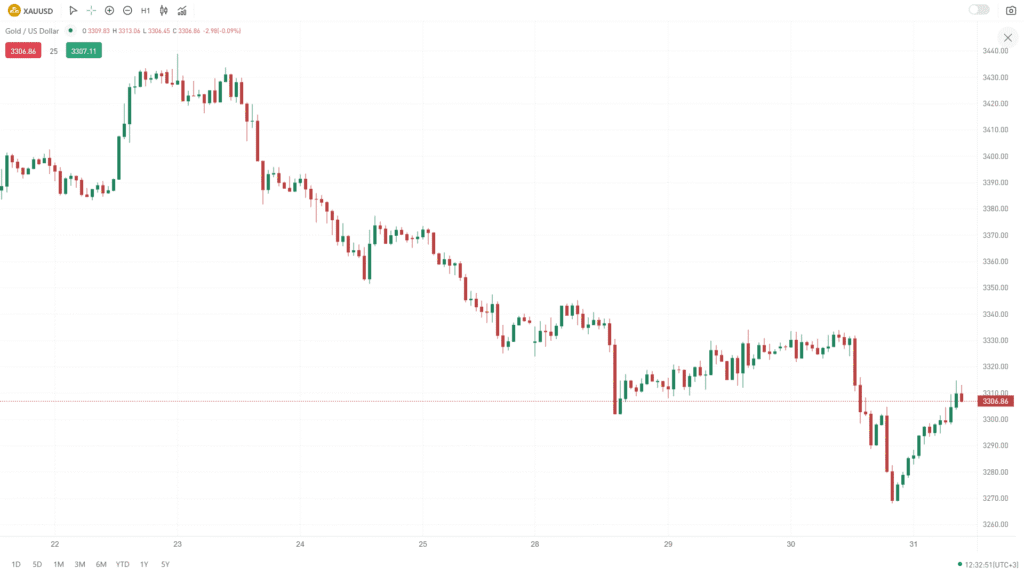
Gold fell USD 28 yesterday. The market was relatively stable traded between 1843-47 during the Asian and European sessions. Selling orders have been triggered by the price breaking the support trendline(1) in the early stage of the US session. At the US Feb. announcements, the price then slid further. It has escaped the 1828-50(2) trading zone and went all the way to the day low near 1814. The day ended at 1818.
Gold is now being shifted to a downtrend after the price escapes the 1828-50(2) trading zone. By using the previous trading zone 1828-50 as a 1:1 reference, the preliminary downside target can be set at 1806 in S-T.
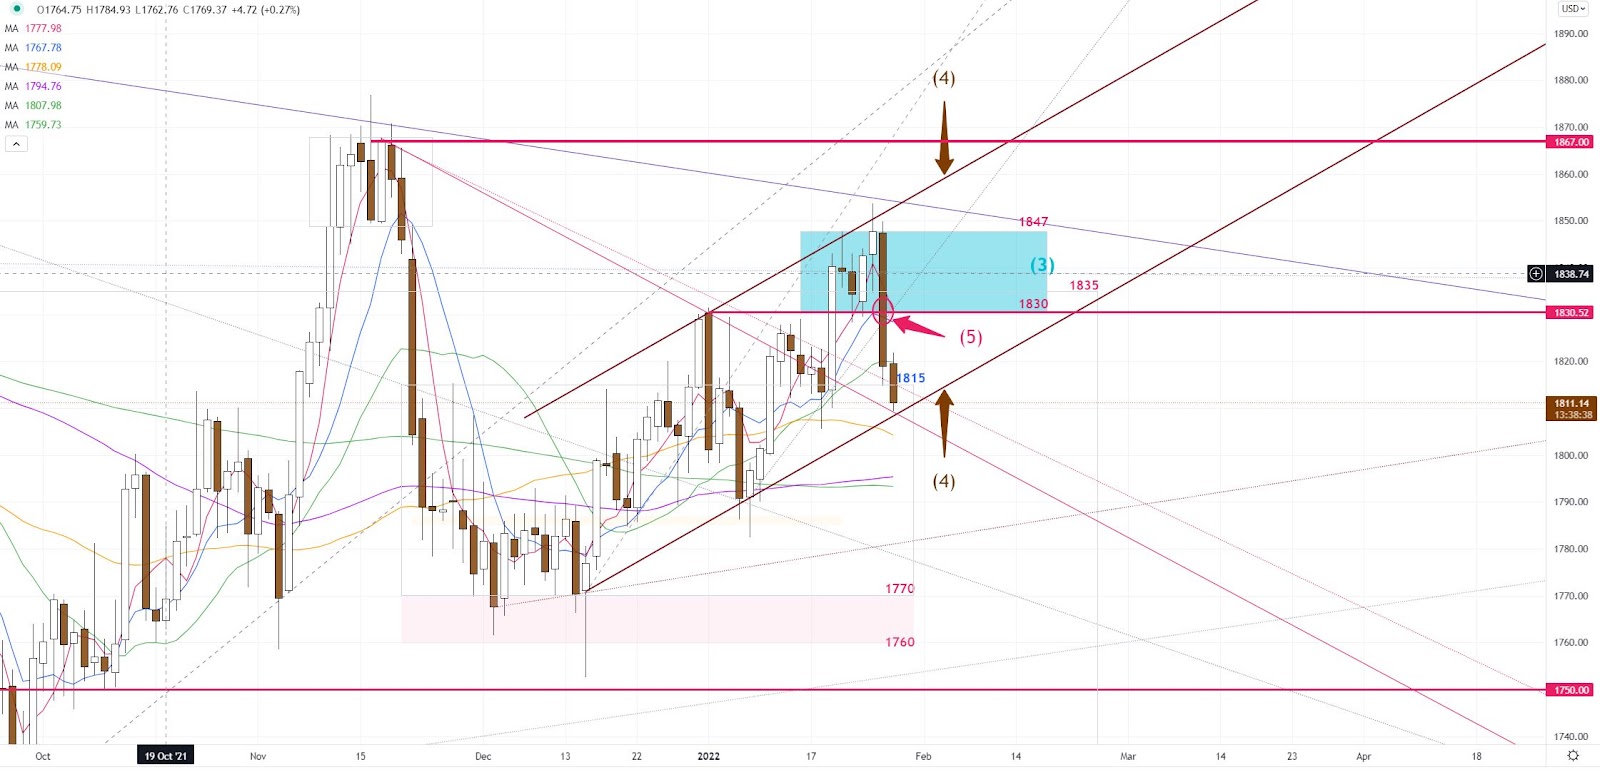
As mentioned yesterday, using the uptrend channel(4) as a blueprint for trading the daily chart shouldn’t be too far off.
S-T Resistances:
1826-28
1820
1815
Market price: 1810
S-T Supports:
1808-06
1800
1795
Risk Disclosure: Gold Bullion/Silver (“Bullion”) trading carries a high degree of risk, and may not be suitable for all investors. The high degree of leverage can work against you as well as for you. This article is for reference only and is not a solicitation or advice to trade any currencies and investment products . Before deciding to trade Bullion you should carefully consider your investment objectives, level of experience, and risk appetite. The possibility exists that you could sustain a loss of some or all of your initial investment or even more in extreme circumstances (such as Gapping underlying markets) and therefore, you should not invest money that you cannot afford to lose. You should be aware of all the risks associated with trading Bullion, and seek advice from an independent financial advisor if you require. Client should not make investment decision solely based on the point of view and information on this article.