 |
| Gold V.1.3.1 signal Telegram Channel (English) |
Gold Trend 16/02
2022-02-16 @ 13:41
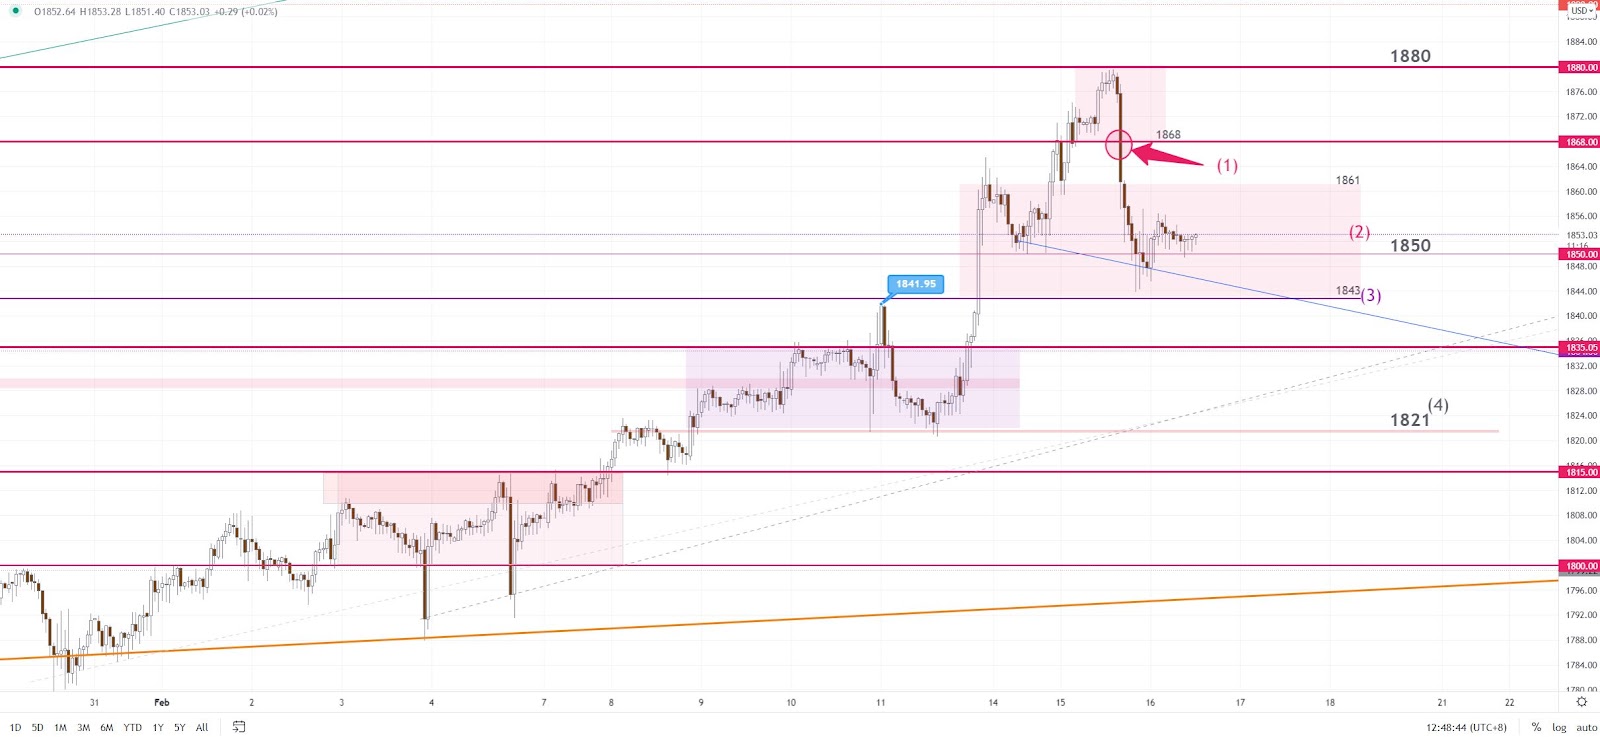
Gold slipped away from the 8-month high yesterday. The market opened at 1870, and the price has reached the new high 1979 early in the Asian session. As Ukraine tensions eased, the price started to pull back. It slid all the way to the day low at 1843 right before the US session. The trade has maintained its range between 1846-55 before the day ended at 1853.
The gold price has retreated right away, breaking the key support 1868(1), once the news was released about Ukraine tensions easing. Expect the trend to turn downward after yesterday. 1943-61(2) can be set as the range for the early trading session. If the price break 1843, the price will go back to 1821(4) level on the downside.
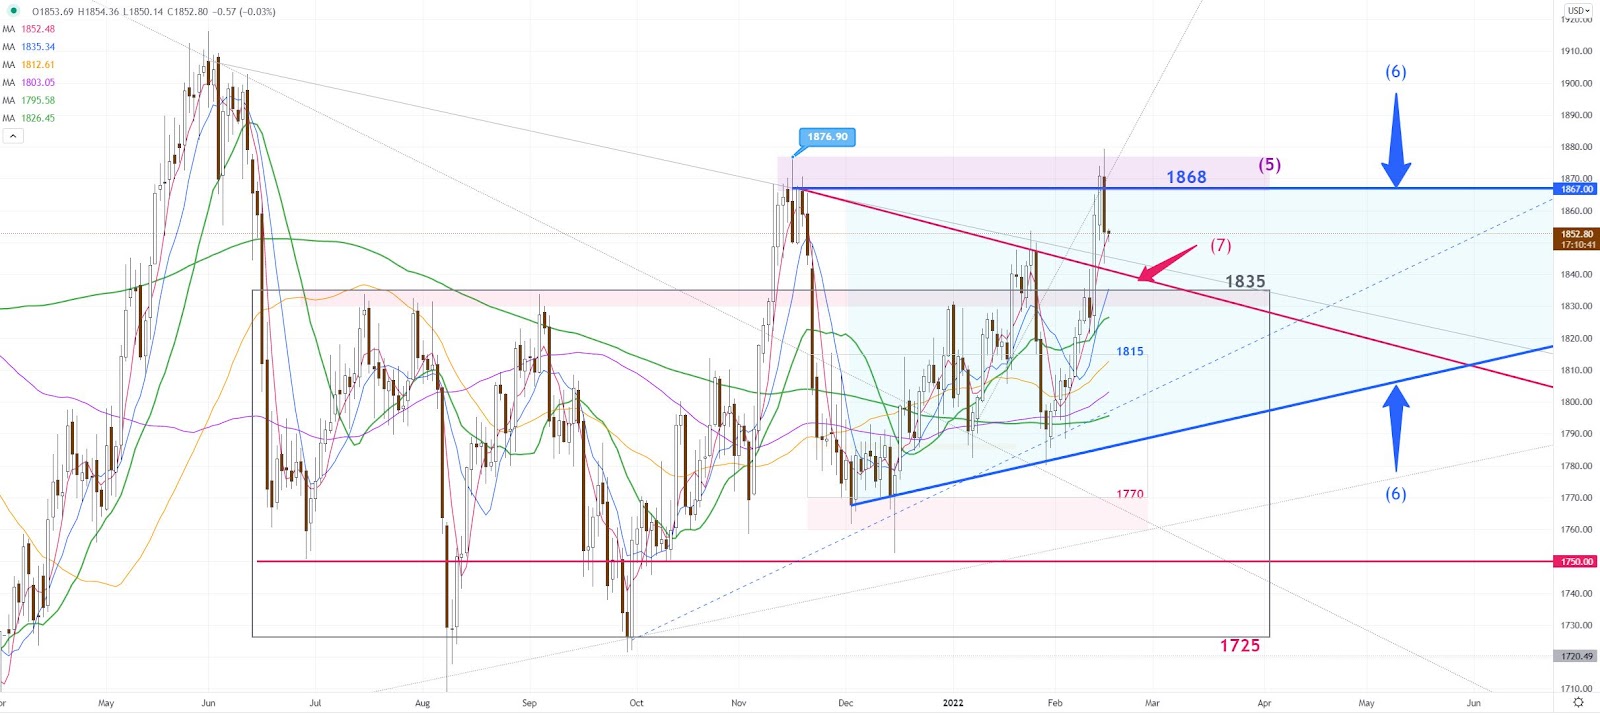
The M-T triangle pattern(6) on the daily chart is remaining in place as the price has failed to clear the resistance zone(4) and to stay above 1868 after all. The drop yesterday created a reversal signal on the chart. The momentum should begin to shift downward, the trend line (7) should be able to provide support in S-T.
S-T Resistances:
1868
1860
1857
Market price: 1852
S-T Supports:
1850
1843
1835
Risk Disclosure: Gold Bullion/Silver (“Bullion”) trading carries a high degree of risk, and may not be suitable for all investors. The high degree of leverage can work against you as well as for you. This article is for reference only and is not a solicitation or advice to trade any currencies and investment products . Before deciding to trade Bullion you should carefully consider your investment objectives, level of experience, and risk appetite. The possibility exists that you could sustain a loss of some or all of your initial investment or even more in extreme circumstances (such as Gapping underlying markets) and therefore, you should not invest money that you cannot afford to lose. You should be aware of all the risks associated with trading Bullion, and seek advice from an independent financial advisor if you require. Client should not make investment decision solely based on the point of view and information on this article.