 |
| Gold V.1.3.1 signal Telegram Channel (English) |
ดอลลาร์สหรัฐแข็งค่าสูงสุดในรอบ 1 ปี!
2024-12-30 @ 00:06
“`html
การเคลื่อนไหวของราคา
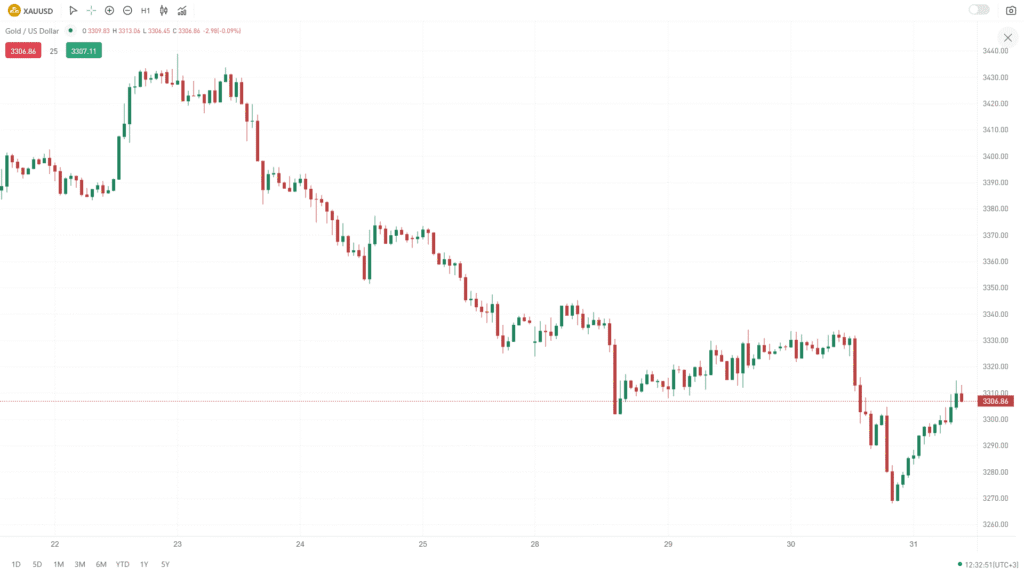
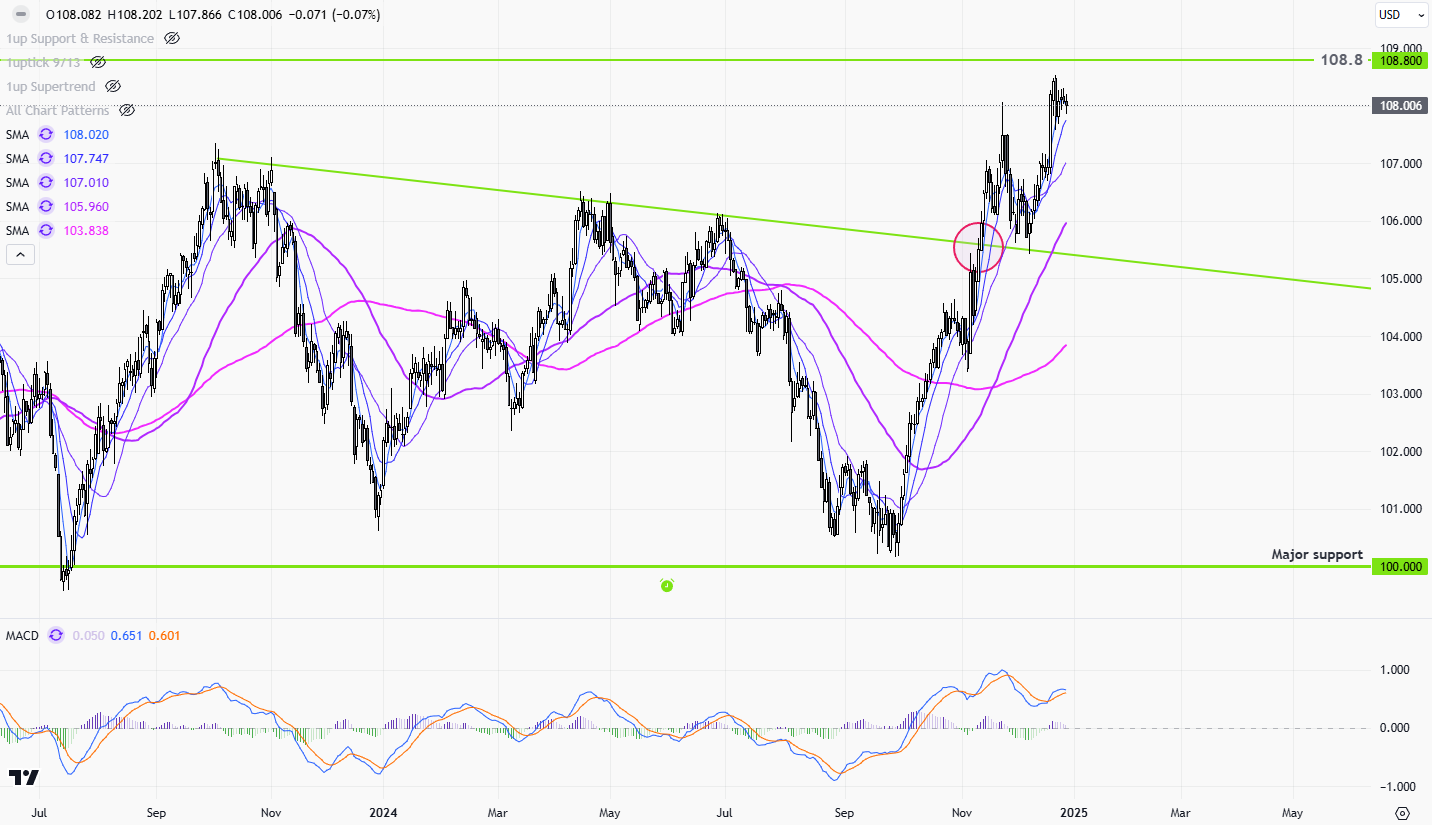
กราฟรายวันของ USD แสดงให้เห็นถึงแนวโน้มขาขึ้นที่แข็งแกร่งในช่วงไม่กี่เดือนที่ผ่านมา หลังจากช่วงของการพักตัว ราคาก็สามารถทะลุระดับแนวต้านที่สำคัญและปรับตัวขึ้นอย่างต่อเนื่อง USD แตะระดับสูงสุดใกล้ 108.800 ซึ่งบ่งชี้ถึงความเชื่อมั่นในเชิงบวกจากนักเทรด แรงผลักดันที่เพิ่มขึ้นนี้ได้รับการสนับสนุนจากปริมาณการซื้อขายที่เพิ่มมากขึ้น สะท้อนให้เห็นถึงความสนใจในการซื้อที่แข็งแกร่ง ในช่วงไม่กี่เซสชั่นที่ผ่านมา USD ยังคงเคลื่อนไหวใกล้ระดับสูงสุดล่าสุด ซึ่งอาจบ่งบอกถึงโอกาสในการปรับตัวขึ้นต่อ อย่างไรก็ตาม การย่อตัวเล็กน้อยที่เห็นในกราฟอาจมีสาเหตุมาจากการขายทำกำไรของนักเทรดบางส่วน
การวิเคราะห์ทางเทคนิค
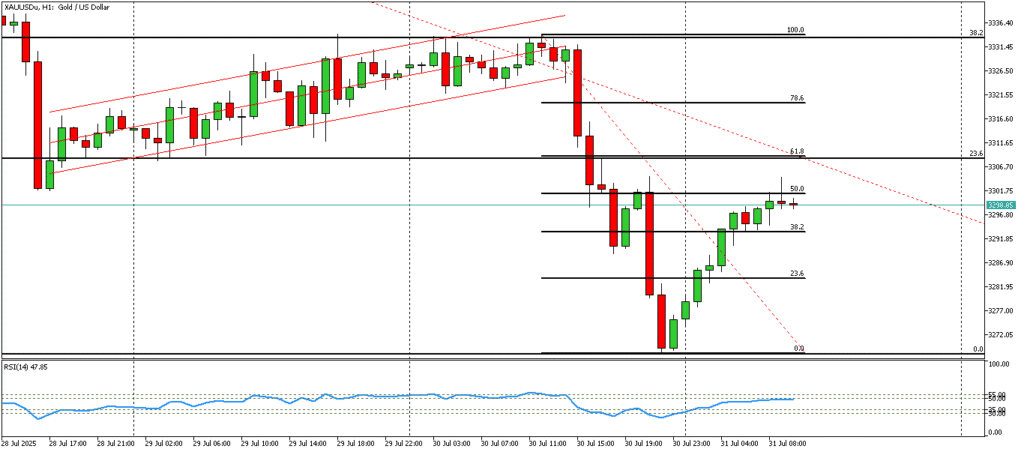
- การทะลุแนวโน้ม: ราคาสามารถทะลุเส้นแนวโน้มขาลงระยะยาว (Marked in Green) ได้สำเร็จ
- ค่าเฉลี่ยเคลื่อนที่: SMA ระยะสั้น (20 และ 50) อยู่เหนือค่า SMA ระยะยาว (100 และ 200) ซึ่งเป็นการยืนยันแนวโน้มขาขึ้นที่ชัดเจน
- MACD Indicator: เส้น MACD อยู่เหนือเส้น Signal Line ซึ่งแสดงถึงโมเมนตัมที่เป็นขาขึ้น
- รูปแบบแท่งเทียน (Candlestick Patterns): แท่งเทียนล่าสุดแสดงถึงไส้เทียนยาวในด้านล่าง (Long Wick Rejections) ซึ่งบ่งบอกถึงแรงซื้อที่แข็งแกร่ง
มุมมองและแนวโน้ม
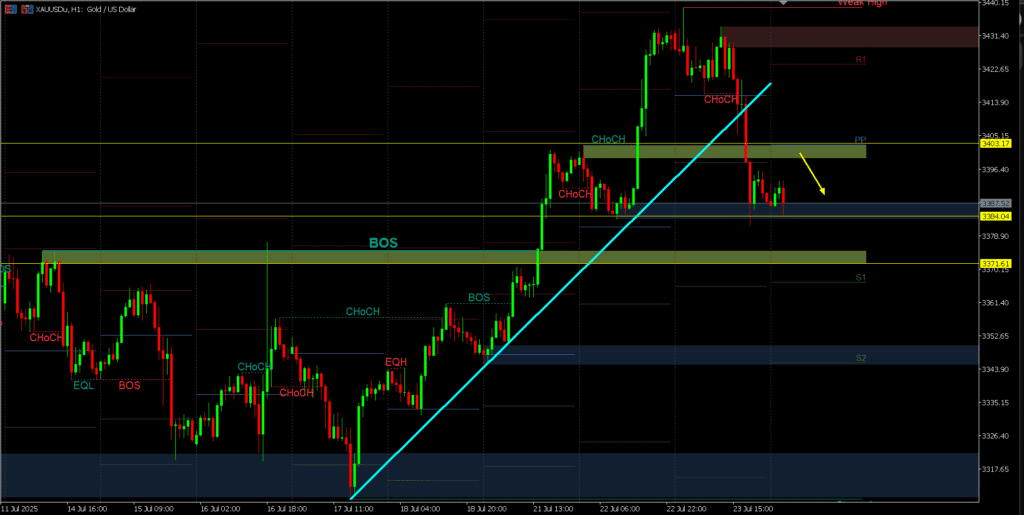
ภาพรวมของ USD ยังคงมีมุมมองขาขึ้น ด้วยแนวโน้มที่เพิ่มขึ้นในปัจจุบันที่ได้รับการสนับสนุนโดยตัวชี้วัดทางเทคนิคที่แข็งแกร่ง การทะลุแนวโน้มขาลงและการจัดเรียงตำแหน่งของค่าเฉลี่ยเคลื่อนที่ต่าง ๆ บ่งชี้ถึงความสนใจในการซื้อที่ต่อเนื่อง อย่างไรก็ตาม การพักตัวใกล้ระดับสูงสุดล่าสุดอาจเป็นสัญญาณของแนวต้านที่อาจเกิดขึ้นและอาจมีการปรับฐานในระยะสั้น นักเทรดควรจับตาดูสัญญาณความแตกต่าง (Divergence) ใน MACD Indicator หรือลวดลายอื่น ๆ ที่บ่งบอกถึงการหมดแรงของการขึ้นราคา นี่อาจเป็นการยืนยันถึงจุดกลับตัวหรือการปรับฐาน สำหรับตอนนี้ การรักษามุมมองขาขึ้นพร้อมกับความระมัดระวังสำหรับการย่อตัวเล็ก ๆ อาจเป็นแนวทางที่เหมาะสม
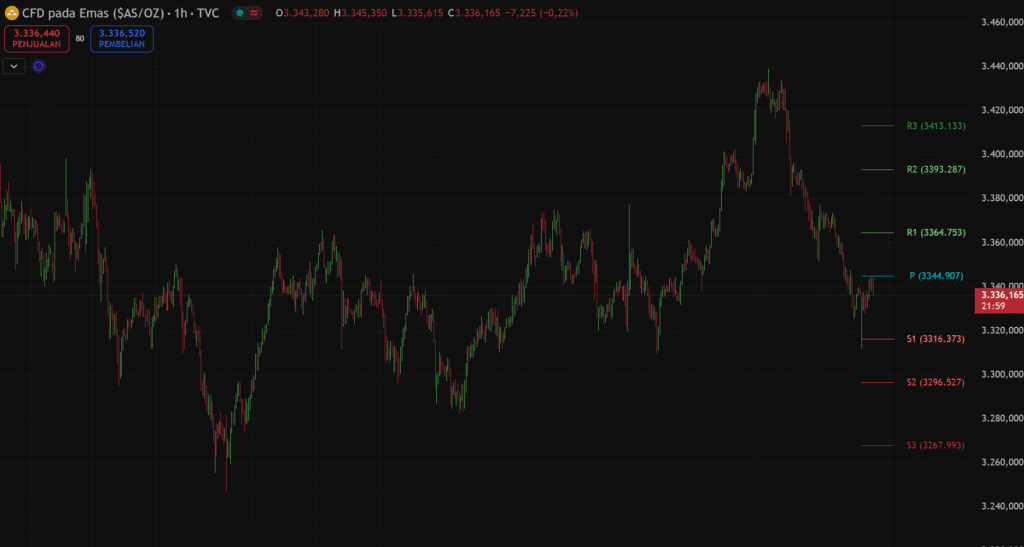
แนวรับและแนวต้าน
| ระดับแนวรับ (Support Prices) | ระดับแนวต้าน (Resistance Prices) |
|---|---|
| 105.000 | 108.800 |
| 102.000 | 110.000 |
| 100.000 | 112.000 |
“`