 |
| Gold V.1.3.1 signal Telegram Channel (English) |

แนวโน้มขาขึ้นของ USDJPY ยังคงอยู่หรือไม่?
2024-12-30 @ 09:51
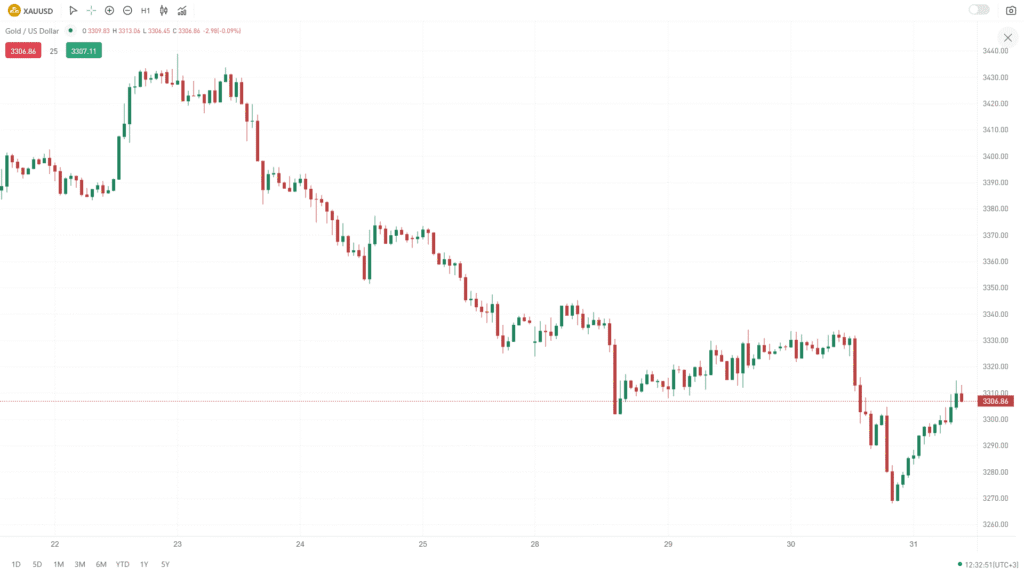
การเคลื่อนที่ของราคา
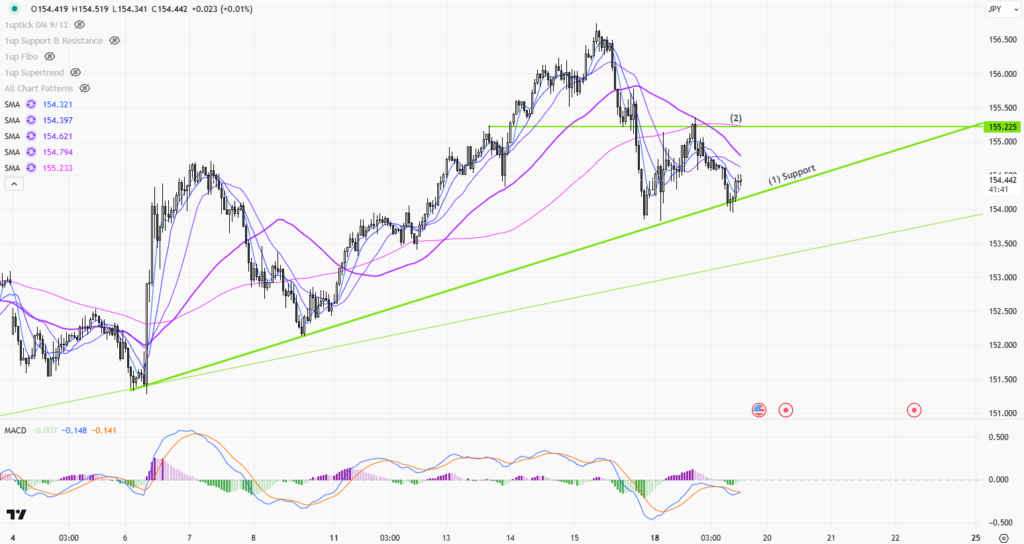
กราฟรายวันของ USD/JPY แสดงแนวโน้มขาขึ้นอย่างต่อเนื่อง โดยราคากำลังเข้าใกล้แนวต้านที่ระดับ 160.1 คู่เงินนี้มีการปรับตัวขึ้นอย่างสม่ำเสมอตั้งแต่ต้นเดือนกันยายน ซึ่งสะท้อนถึงความเชื่อมั่นในฝั่งขาขึ้นที่แข็งแกร่ง รูปแบบแท่งเทียนบ่งชี้ถึงการสร้างจุดสูงสุดและจุดต่ำสุดที่สูงขึ้นอย่างต่อเนื่อง ซึ่งถือเป็นลักษณะของแนวโน้มขาขึ้นที่ชัดเจน เมื่อไม่นานมานี้ ราคายังได้ทดลองแนวรับของเส้นแนวโน้มขาขึ้นแล้วเคารพระดับดังกล่าว ซึ่งบ่งชี้ถึงโอกาสในการคงแนวโน้มขาขึ้นต่อไป ความผันผวนของตลาดดูเหมือนจะลดลงเมื่อเทียบกับเดือนก่อนหน้า ซึ่งอาจหมายถึงการพักตัวเพื่อสะสมกำลังก่อนที่จะพยายามทะลุแนวต้านต่อไป
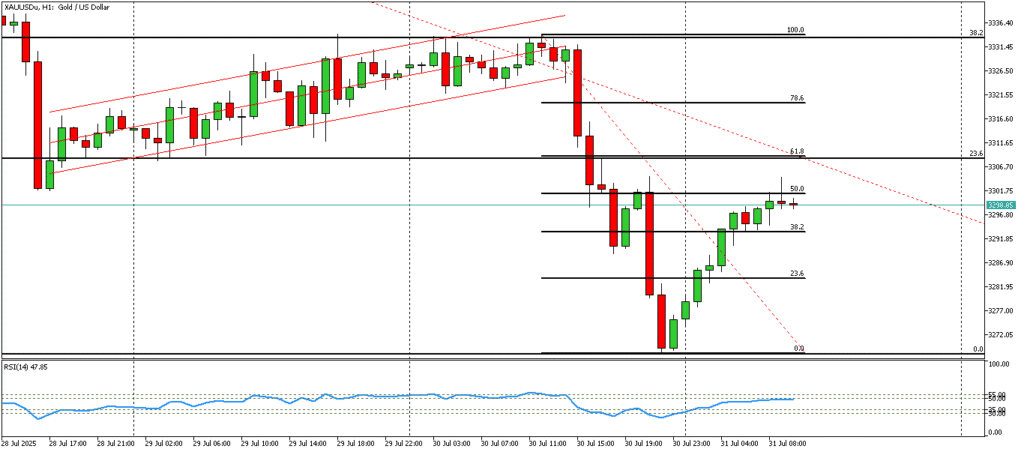
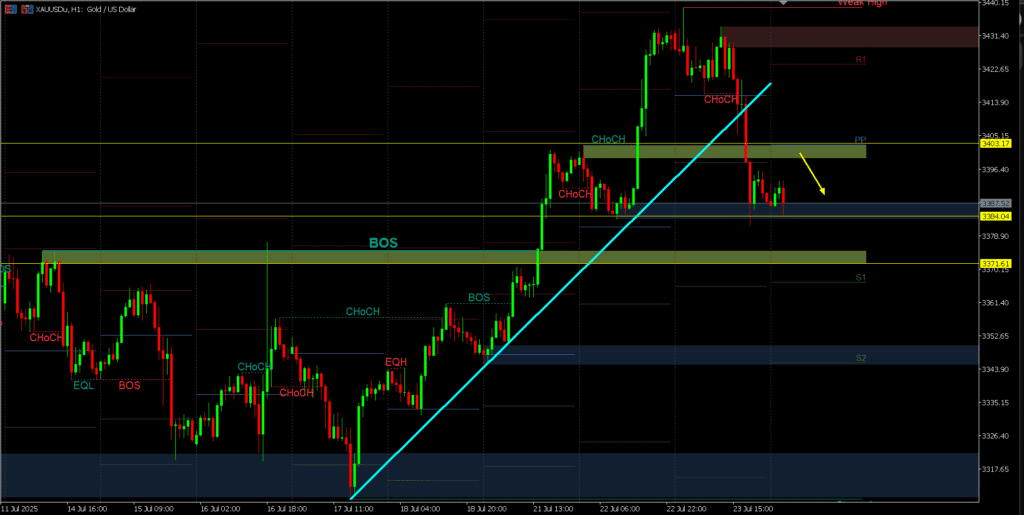
การวิเคราะห์ทางเทคนิค
มุมมองในอนาคต
ตัวชี้วัดทางเทคนิคในปัจจุบันชี้ให้เห็นมุมมองเชิงบวก (Bullish) สำหรับ USD/JPY เนื่องจากราคายังคงปรับตัวไต่ขึ้นเข้าใกล้แนวต้านสำคัญที่ระดับ 160.1 ค่าเฉลี่ยเคลื่อนที่ยังคงแสดงแนวรับที่แข็งแกร่งสำหรับการสานต่อแนวโน้มขาขึ้นนี้ อย่างไรก็ตาม นักเทรดควรจับตาการทะลุผ่านแนวต้านดังกล่าว ซึ่งอาจเป็นสัญญาณของการปรับตัวเพิ่มขึ้นไปต่อได้ แต่ก็ไม่ควรมองข้ามความระมัดระวัง เนื่องจากอาจมีการพักตัวหรือการดึงกลับหากแนวต้านยังคงอยู่ ขอแนะนำให้ติดตาม MACD และเส้นแนวโน้มอย่างใกล้ชิดเพื่อสังเกตสัญญาณของการกลับตัวหรือการเคลื่อนไหวต่อไป
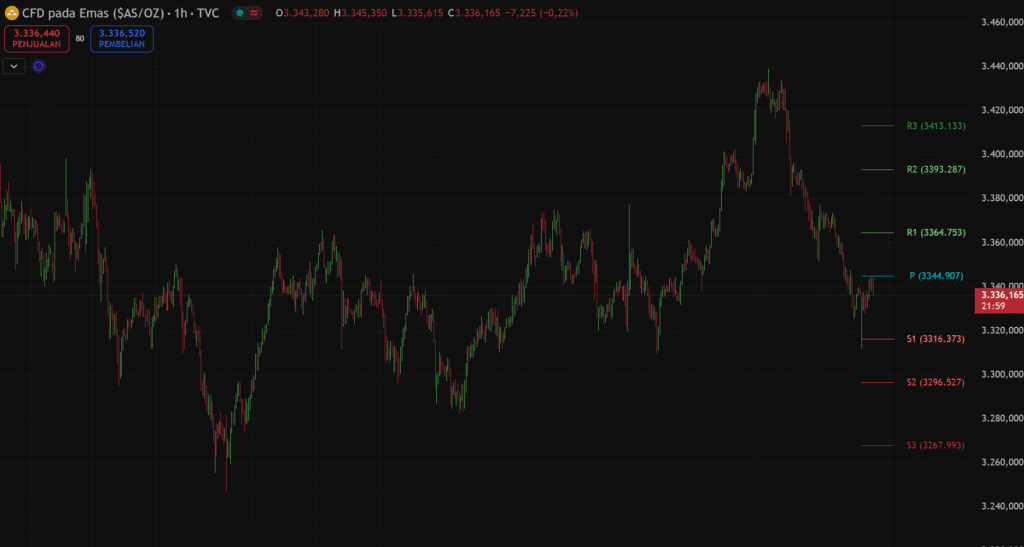
แนวรับและแนวต้าน
| ระดับแนวรับ | ระดับแนวต้าน |
|---|---|
| 153.48 | 157.59 |
| 153.78 | 160.1 |
| 156.2 | 162.0 |