


 |
| Gold V.1.3.1 signal Telegram Channel (English) |

GBP/USD Forecast: Bearish Trend and Key Resistance Levels for December 27
2024-12-28 @ 12:01
GBP/USD Forecast: Bearish Trend and Key Resistance Levels for December 27
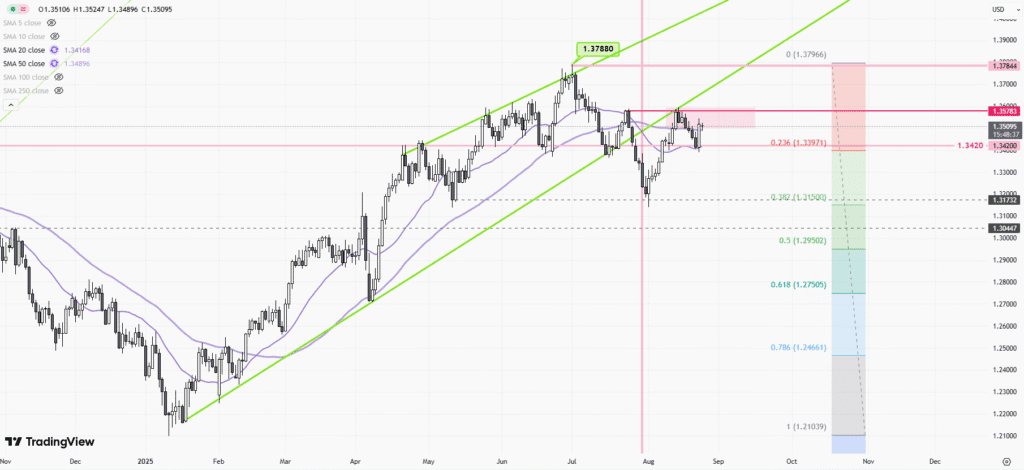
The GBP/USD currency pair continues to move within a descending channel, reflecting a short-term bearish trend. As of the latest forecast, the Pound to US Dollar exchange rate on Forex is 1.2523. Moving averages indicate the presence of a bearish trend, with prices breaking through the area between the signal lines downwards. This suggests pressure from sellers of the currency pair and a potential continuation of the instrument’s fall.
Key Resistance Levels
The current forecast suggests an attempt to develop a bullish correction of the British Pound against the US Dollar and a test of the resistance area near the 1.2565 level. A rebound in the pair quotes downwards and a continuation of the fall of the British Pound against the US Dollar currency pair is expected. The target for the pair’s decline, within the Forex forecast, is the area at the level of 1.2365.
Additional Signals
– RSI Test: An additional signal in favor of the fall of the currency pair will be a test of the resistance line on the relative strength indicator (RSI).
– Triangle Pattern: The second signal in favor of the decline will be a rebound from the upper border of the “Triangle” pattern.
– Breakout Conditions: The cancellation of the fall option for the Pound Dollar pair will be a strong growth and a breakout of the resistance area with the price fixing above the level of 1.2655. This will indicate a breakout of the resistance level and a continuation of the growth of the Pound Dollar pair to the area at the level of 1.2785.
Market Analysis
The GBP/USD H4 outlook indicates that the pair’s bearish trend is weakening, as suggested by the Ichimoku cloud, RSI, and MACD. However, the waning bearish momentum could signal potential consolidation or a reversal in the near term. Traders should closely monitor the upcoming US data releases and any geopolitical developments that might impact the GBP/USD forecast.
Technical Indicators
– Ichimoku Cloud: The price is trading below the Kumo (cloud), which signals GBPUSD’s bearish bias. However, a close above the Tenkan-Sen (red line) could indicate short-term bullish pressure.
– MACD: The MACD line is below the signal line, with a negative histogram value, highlighting continued bearish momentum. However, the declining size of the histogram bars suggests that bearish pressure is waning.
– RSI: Currently at 43.79, the RSI suggests neutral-to-bearish conditions, as the indicator remains below the 50-mark. This indicates that sellers still have control, but the market is not yet oversold.
Key Levels to Watch
– Resistance: 1.2565
– Support: 1.2365
– Breakout Level: 1.2655
– Reversal Level: 1.2785
Trading Considerations
– A breakout above 1.25387 would be a bullish confirmation.
– A breakdown below 1.25143 could signal further downside risks.
– Traders should closely monitor the upcoming US data releases and any geopolitical developments that might impact the GBP/USD forecast.