![[Daily Closing 🔔] Gold – Gold Prices Climb to New Highs on Tuesday as Weaker Dollar Boosts Safe-Haven Demand](https://int.1uptick.com/wp-content/uploads/2025/05/2025-05-22T004512.731Z-file-1024x576.png)
![[Daily Closing 🔔] Gold – Gold Prices Surge Nearly 2% to $3,287.60 as Weaker US Dollar Fuels Rally](https://int.1uptick.com/wp-content/uploads/2025/05/2025-05-20T224010.678Z-file-1024x576.png)
 |
| Gold V.1.3.1 signal Telegram Channel (English) |
Gold Trend 24/02 – Take advantage of the S-T sideway range!
2025-02-24 @ 16:55
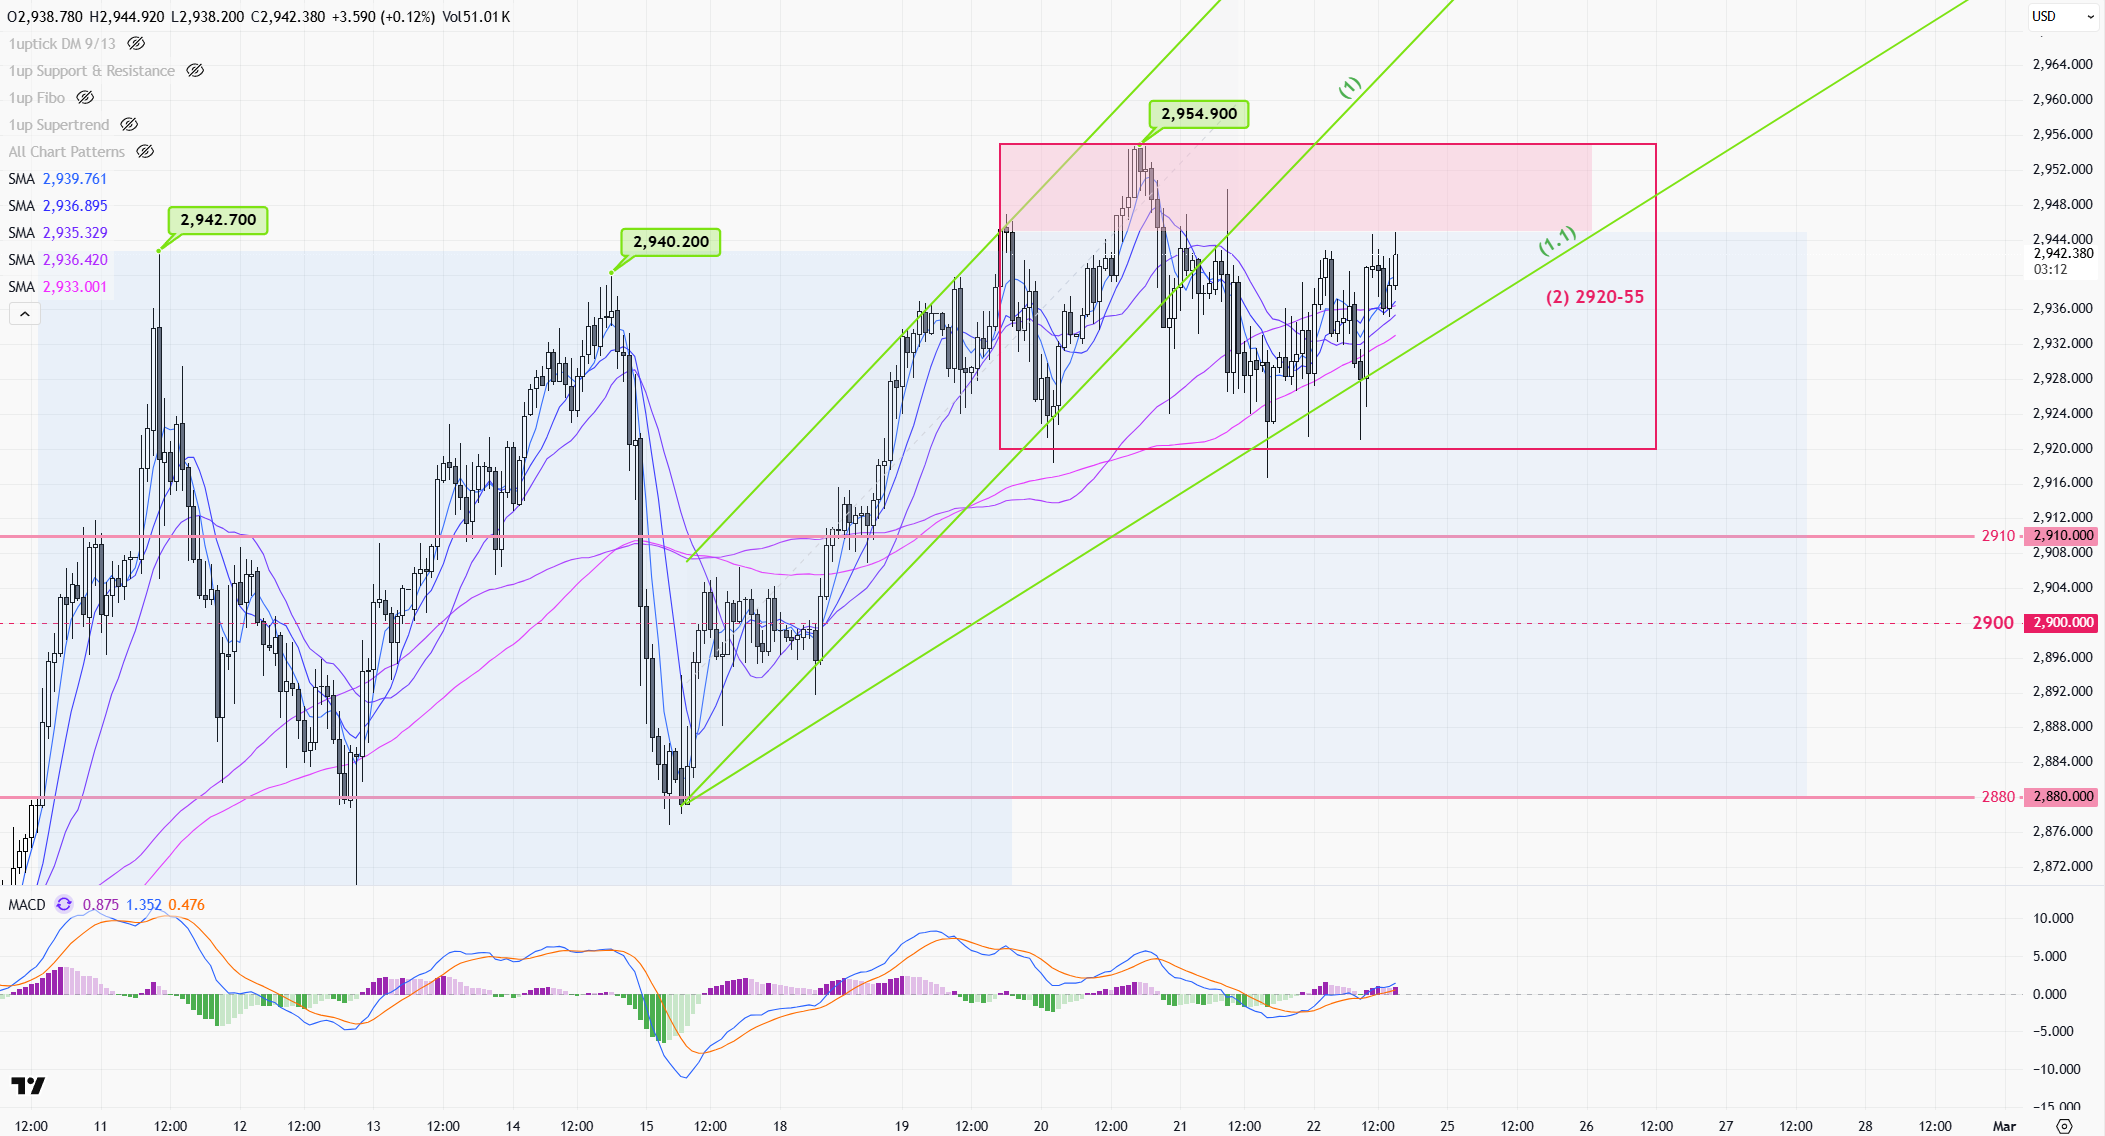
Two weeks ago, the U.S. and Russia began negotiations for a ceasefire, causing gold prices to plummet from their high of $2,940 before the weekend. However, as the weekend passed without any progress, gold prices rebounded after opening on Monday, rising from their lowest point of $2,879 to a new high of $2,954 in the European session on Thursday. Yet, after surpassing the previous high, gold prices did not continue to rise and retreated to around $2,935 before the weekend close.
Last week, gold prices attempted to break through the high three times but failed to stay above $2,945. The failure to break through suggests that selling pressure remains strong above $2,945, new news or economic figures are needed to stimulate the price to go for a new high. This week, we will be watching the U.S. GDP for Q4 on Thursday and the U.S. PCE inflation data on Friday.
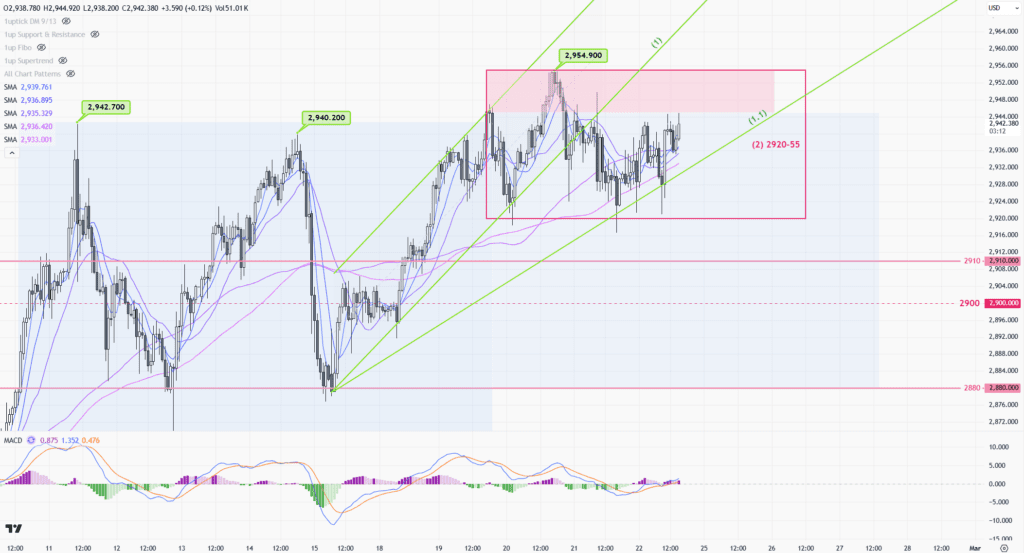
1-hour chart (above) > The upward trend shows signs of slowing down. The upward support has slowed down from (1) to (1.1), and the trend has entered a relatively sideways state. The operating range is temporarily 2920-55(2) before the price escape.

Daily chart (above) > The overall trend fluctuates at a high level in the range of 2920-55, waiting for a breakout. You can still seize the opportunity to buy on the 10-day line, just like the last 2 weeks. In terms of trend, if the 5-day line falls below the 10-day line, it will be a reversal signal for a downward adjustment.
P.To
Latest Technical Analysis
![[Daily Closing 🔔] Gold – Gold Prices in New York Swing Sharply as Geopolitical Tensions and Dollar Strength Drive Market Uncertainty](https://int.1uptick.com/wp-content/uploads/2025/05/2025-05-22T235933.071Z-file-1024x576.png)