


 |
| Gold V.1.3.1 signal Telegram Channel (English) |

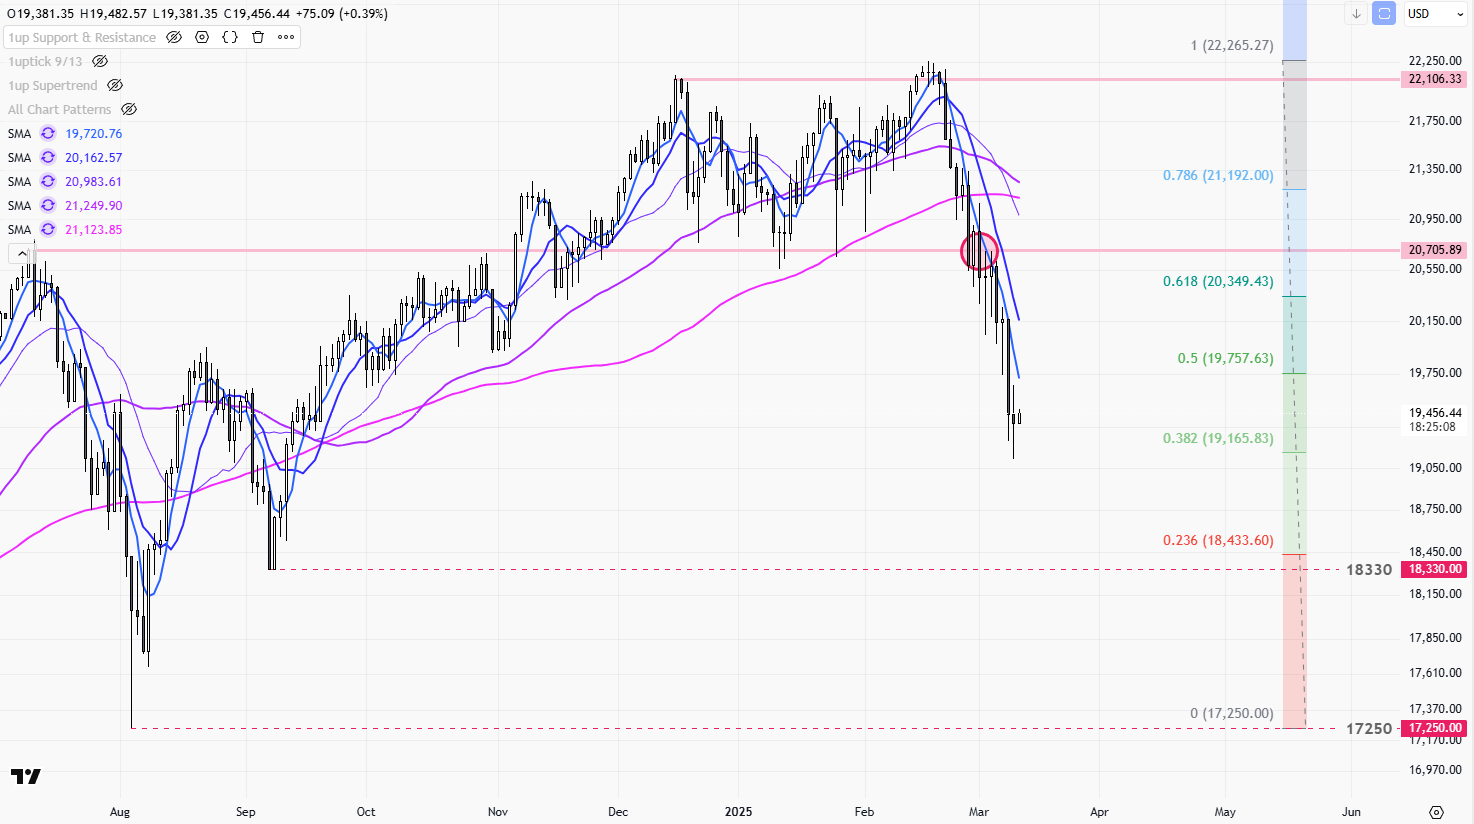
Nasdaq toward 18330 ?
2025-03-12 @ 11:23
Price Movement
The chart provided showcases a recent decline in the Nasdaq index, following a significant uptrend observed in the latter half of the previous year. Initially, the index displayed bullish momentum, characterized by higher highs and higher lows, indicating strong buying interest. However, a recent downturn began in the first quarter of 2025, with prices breaking below key moving averages, signaling a shift in market sentiment. The price action has demonstrated a clear bearish trend as the index fell below its 21,000 level. The candlesticks reflect a series of lower highs and lower lows, confirming the weakening of bullish momentum. This is further substantiated by a crossover in the moving averages, suggesting the potential continuation of the downward trend. Currently, the index is experiencing a pullback, with prices stabilizing around the 19,450 mark. This area may act as a support level, providing potential buying interest. Nonetheless, the overall sentiment remains bearish as technical indicators exhibit downward pressure.
Technical Analysis
| Pattern/Indicator | Description | Impact on Trend |
|---|---|---|
| Moving Averages | Price is below 9, 13, and 21-day SMAs | Indicates bearish momentum and potential continuation of downtrend |
| Fibonacci Retracements | Prices near 0.5 retracement level at 19,757.63 | Possible support level, if breached, could lead to further decline |
| Death Cross | 9-day SMA crossed below 21-day SMA | Strong bearish indicator, suggests further downside |
| Resistance Levels | Overhead resistance at 20,705.89 | Could hinder bullish attempts to reverse trend |
Outlook
The current outlook for the Nasdaq appears bearish, given the evidence from technical indicators and chart patterns. The established death cross and sustained trading below critical moving averages suggest continuous downward pressure on prices. Moreover, the price action has reinforced the existing downtrend, especially with a strong resistance level overhead. While the Fibonacci retracement level at 19,757.63 presents possible support, any breach of this level could lead to further declines. Therefore, the overall sentiment remains cautious with a bearish bias unless significant bullish signals emerge, indicating potential reversals in the current trend.
Support and Resistance
| Support Levels | Resistance Levels |
|---|---|
| 18,433.60 | 20,705.89 |
| 19,165.83 | 21,192.00 |
| 17,250.00 | 22,106.33 |