


 |
| Gold V.1.3.1 signal Telegram Channel (English) |
Gold Price Trends & Analysis: How U.S.-China Trade Talks and Economic Data Are Shaping the Market
2025-04-25 @ 14:51
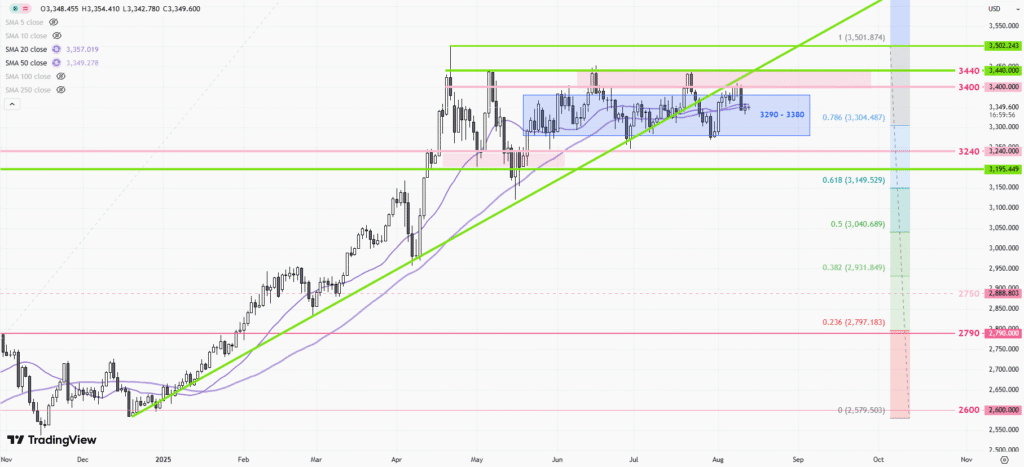
Spot gold remained volatile near its recent highs following the close of U.S. markets on April 25. After settling at $3,314.75 per ounce the previous afternoon, prices climbed during Asian trading hours to $3,354.29. However, optimism stemming from progress in U.S. trade negotiations with major Asian partners dampened demand for safe-haven assets, causing gold to ease back. By the close of trading in New York, gold stood at $3,318.71, fluctuating about 1.1% on the day.
Gold has now risen for three consecutive weeks, underscoring continued structural support for safe-haven demand. Investors are closely watching the direction of U.S. trade policy and the Federal Reserve’s stance on interest rates—two major factors influencing the U.S. dollar and real interest rates, and by extension, the price of gold.
Reports from Washington suggest the U.S. is accelerating negotiations with Japan and South Korea over tariff agreements, aiming to reach meaningful progress before the mutual tariff suspension deadline in July. This development has slightly curbed short-term demand for gold as a hedge, softening its upward momentum. Still, Treasury Secretary Wally Adeyemo clarified that no tariff-reduction agreement has been reached with China. The lack of clarity around U.S.-China trade relations is keeping investor caution intact and providing gold with some underlying support.
Meanwhile, U.S. economic data revealed a slowdown in growth momentum. The S&P Global Composite PMI fell to 51.2 in April—a 16-month low. Despite softer data, Fed officials have refrained from signaling near-term rate cuts, emphasizing the need to monitor the lagging effects of current tariffs on inflation and economic activity. The U.S. dollar index rebounded by 0.3% from a three-month low, putting additional pressure on dollar-denominated gold.
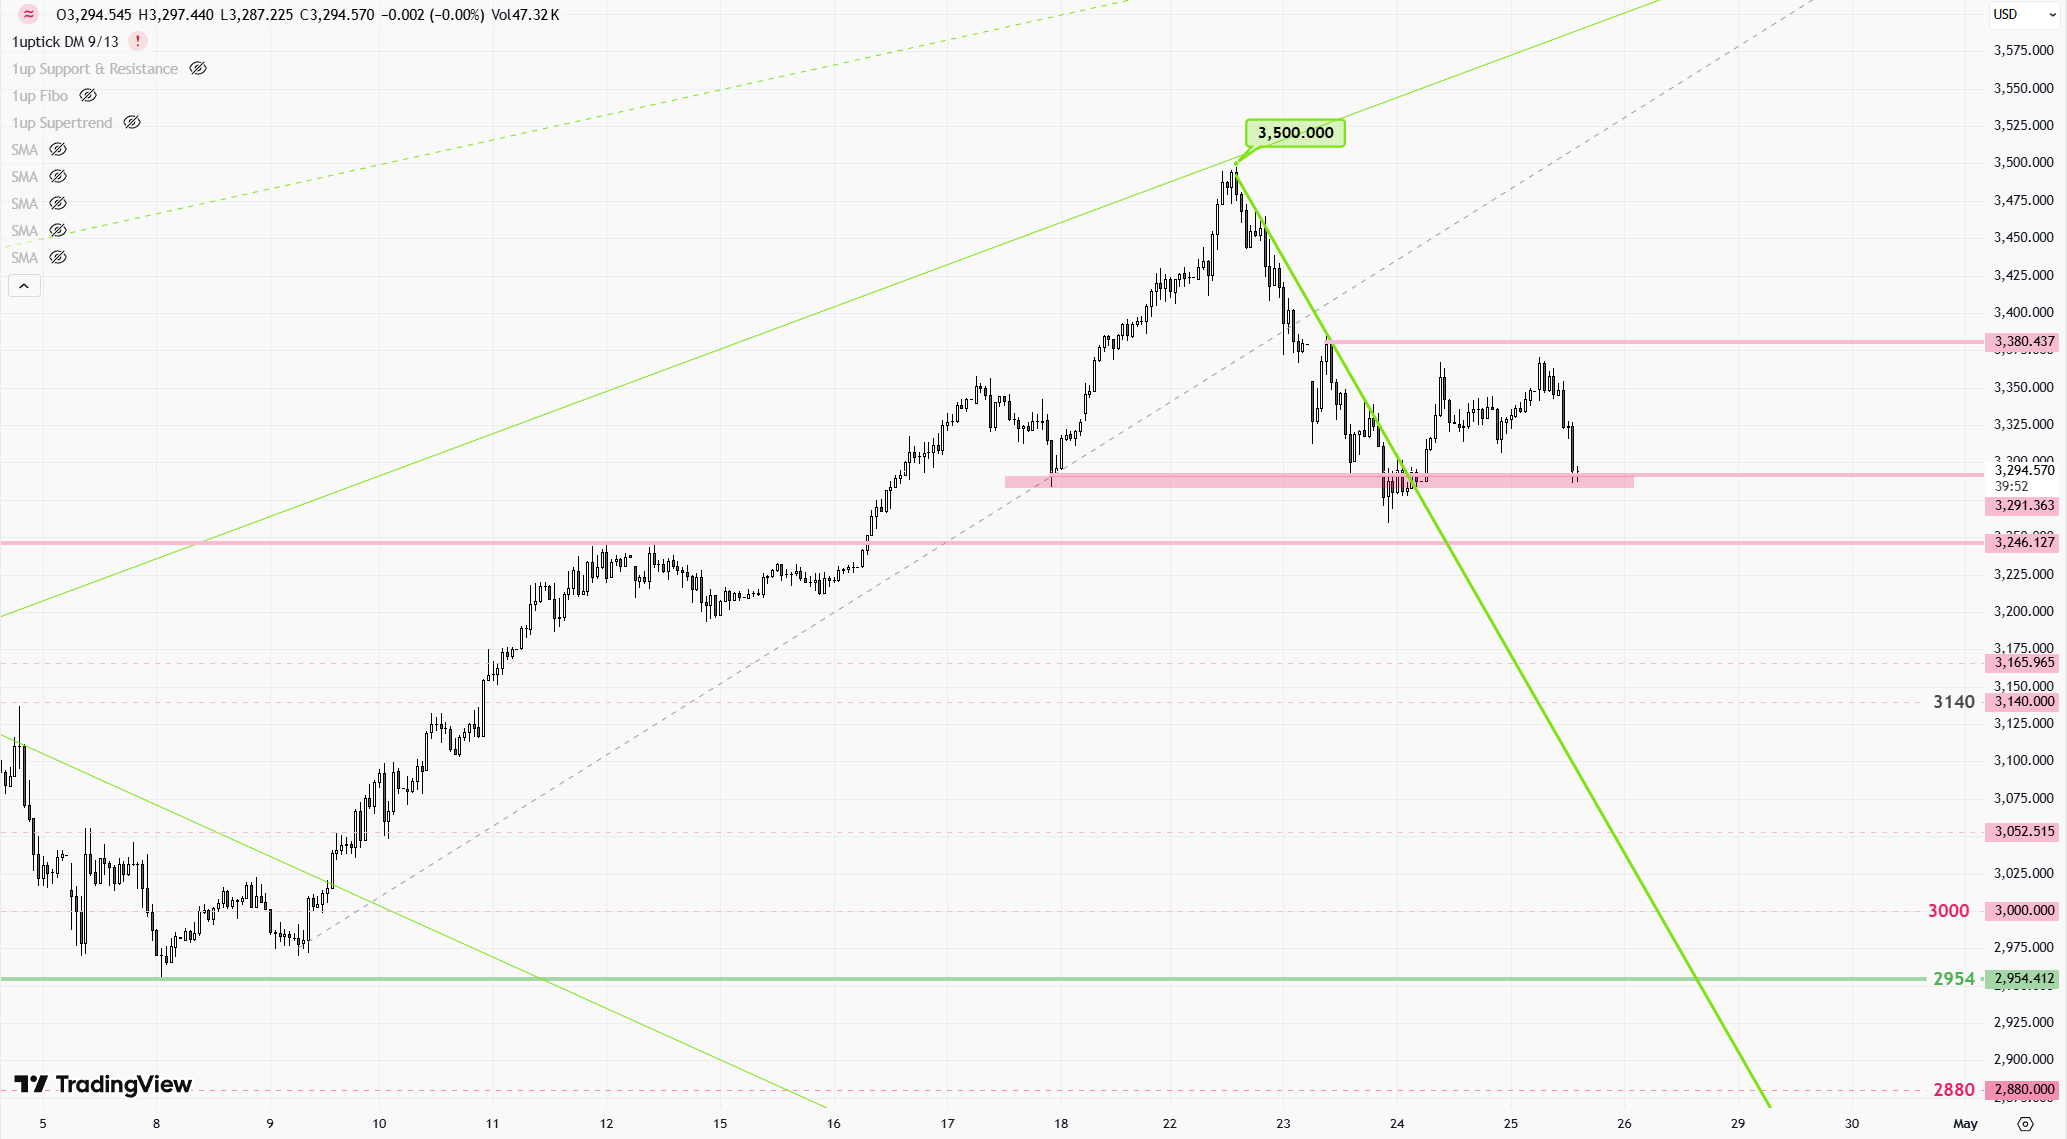
From a technical perspective, gold is showing strong support around the $3,200 level, which also aligns with the 50-day moving average. If prices dip below this range, the next level to watch is $3,175. On the upside, $3,400 remains a key resistance level. Breaking above it could shift market focus toward the record high of $3,500.
Looking ahead to the next 24 hours, market attention will center on upcoming U.S. core PCE inflation data and developments in U.S.-China trade talks. If inflation prints higher than expected, it could push back expectations for Fed rate cuts, pressuring gold prices in the short term. Conversely, signs of uncertainty or setbacks in U.S.-China negotiations may spark renewed demand for gold as a safe-haven asset.
All in all, despite the recent pullback after a strong rally, gold remains well-supported. Traders may consider focusing on the $3,200 to $3,300 technical range. Should fundamental conditions align, a renewed push toward the $3,400 level remains on the table.