


 |
| Gold V.1.3.1 signal Telegram Channel (English) |
Gold Prices Plunge After Hitting Record Highs: In-Depth Analysis of Market Trends and Smart Risk Management Strategies
2025-04-24 @ 02:25
Over the past few months, gold has taken center stage in global markets. Amid heightened risk aversion and persistent inflation pressures, gold prices have surged more than 15% year-to-date—sharply outpacing the S&P 500, which has tumbled over 15%. This stark performance gap has caught the attention of investors worldwide. But recently, gold’s momentum has shown signs of slowing. After touching a record high of $3,500 per ounce, prices pulled back to around $3,318 within a single day, prompting investors to question whether the rally still has legs.
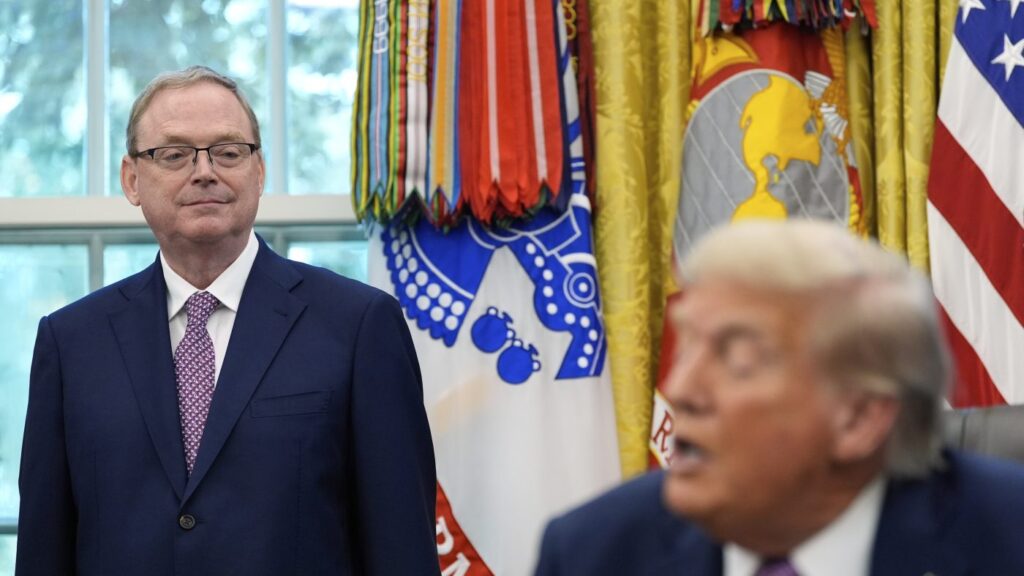
A major shift in momentum has been driven by changes in policy signals from former U.S. President Donald Trump. His earlier hardline stance toward China and the Federal Reserve had stoked haven demand, boosting both gold and the U.S. dollar. However, after he softened his tone on tariffs and the Fed recently, market sentiment took a U-turn. Safe-haven buying faded rapidly, and money began flowing back into stocks and other risk assets. In fact, gold ETFs saw over $5 billion in outflows just this week—a clear sign of sentiment shifting among both institutional and retail investors.
Even so, gold has so far managed to stay above some key technical support levels. Analysts point to $3,286 as a crucial near-term threshold—if it holds, a rebound may be in the cards. A senior analyst at OANDA noted that while there are signals of a short-term pullback, there’s no evidence yet of a true bearish reversal. Bulls still have a strong foothold—for now.
Wall Street remains mostly bullish on gold’s longer-term trajectory. JPMorgan anticipates gold could climb to $3,675 by the fourth quarter of 2025, potentially breaking past the $4,000 mark in the first half of 2026. Goldman Sachs is even more optimistic, projecting that gold could exceed $4,500 under a favorable scenario. Still, some caution that the market may be running too hot in the short run, noting that technical indicators look overbought and that a healthy correction may be needed.
On the demand side, central banks have continued to accumulate gold at a steady pace, providing important fundamental support. But on the flip side, physical gold ETFs just recorded their biggest single-week outflow since 2013. This divergence points to growing uncertainty—official buyers are still active, while retail investors seem more hesitant. “You’re seeing a clear split,” noted one market analyst. “Central banks are stepping in, but retail investors are starting to step back. That kind of divergence always raises red flags for forward momentum.”
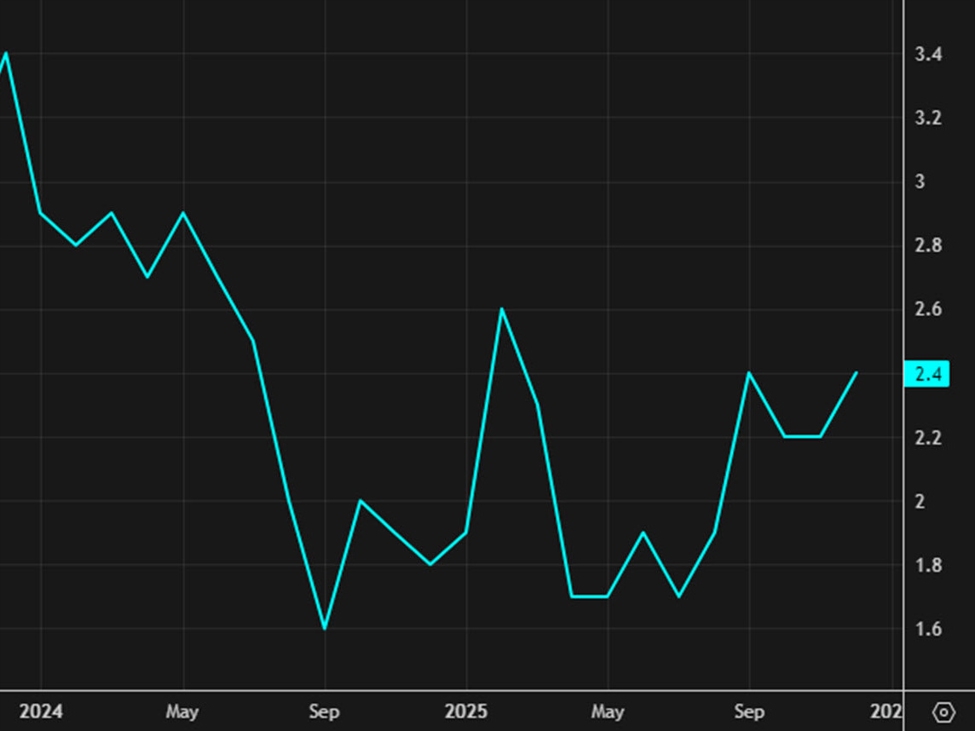
From a technical perspective, this week’s daily chart for gold shows a prominent bearish candlestick resembling a ‘shooting star’ pattern. The RSI also sits deep in overbought territory—a combination that’s making traders more cautious. If prices slide below $3,292, a key Fibonacci retracement level, analysts warn that the next stop could be the $3,164 support zone—potentially shaking investor confidence.
Veteran traders have also pointed out that whenever gold trades more than 20% above its 200-day moving average, a meaningful correction or reversal often follows. That metric is now at levels not seen since 2008, suggesting the risk of a pullback is mounting.
Looking ahead, $3,500 remains a psychologically significant level. If prices can reclaim and hold above it, that could spark renewed buying. But if support continues to erode, the market may enter a broader consolidation phase.
Ultimately, the Federal Reserve’s monetary policy will be a key driver for gold moving forward. Weaker U.S. economic data could revive expectations of rate cuts, which would lift gold’s appeal as a hedge. But if risk assets bounce back and the dollar strengthens, gold’s short-term rally may face stiff headwinds.
For everyday investors, what’s most important in this volatile environment isn’t chasing short-term price swings—it’s having a sound risk management strategy. Even the strongest bull runs need to pause, and not every correction signals the beginning of a downtrend. In challenging times like these, a cautious and well-balanced approach remains the smartest path forward.