


 |
| Gold V.1.3.1 signal Telegram Channel (English) |
Gold Prices Swing as Weakening Dollar Supports Bullish Momentum – Thursday Market Outlook
2025-04-17 @ 13:18
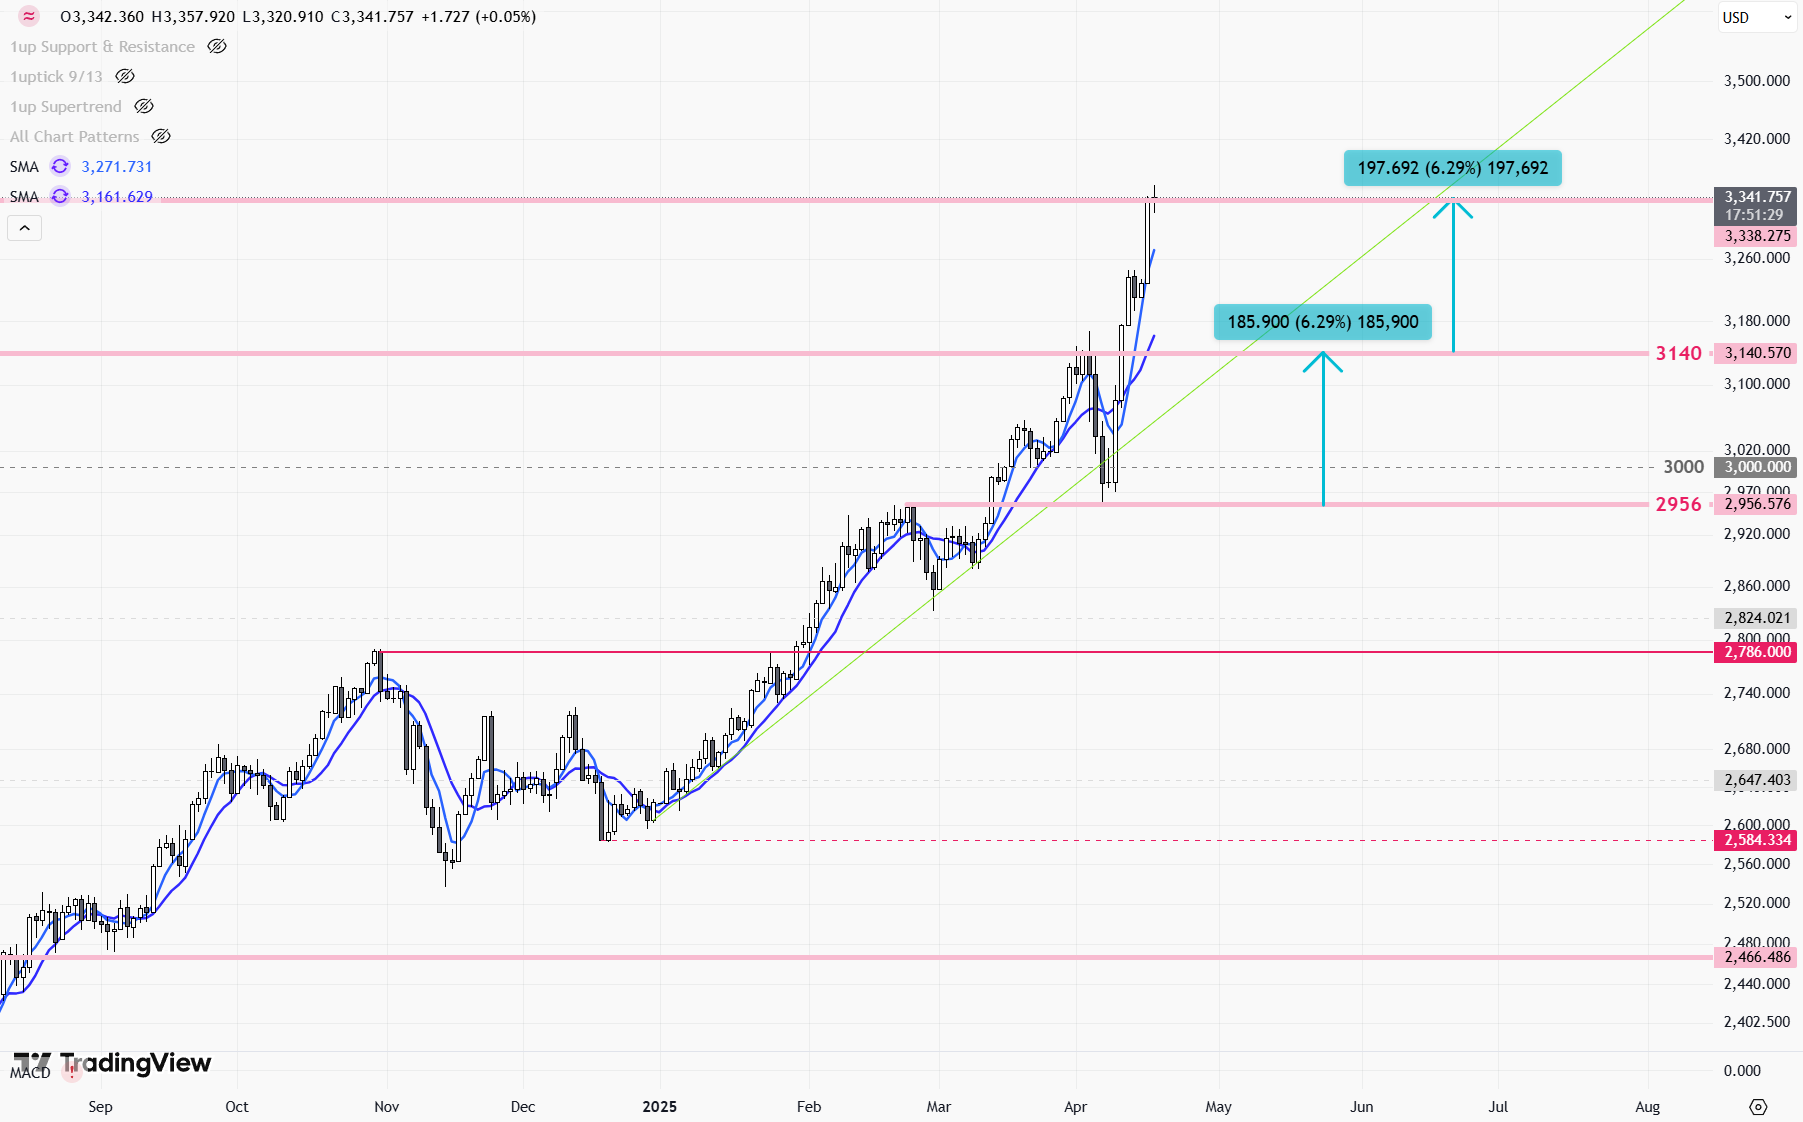
In the past 24 hours, spot gold (XAU/USD) has been on a roller coaster, showing strength before giving up gains. On Wednesday (April 16), gold opened at $3,251.91 per ounce. Following weaker-than-expected U.S. industrial production data and a pullback in the U.S. dollar, prices surged to an all-time high of $3,357.77 before settling at $3,350.05—up nearly 2.93% on the day. However, during Thursday’s (April 17) Asian and European sessions, gold prices eased from their highs, last quoted at $3,345.86, down about 0.13%.
The dip in U.S. March industrial production—down 0.2% versus expectations—raised fresh concerns about a slowdown in the manufacturing sector, dragging the dollar index down. This gave gold bulls additional momentum as investors boosted their exposure to safe-haven assets. Meanwhile, March retail sales unexpectedly climbed 1.3%, suggesting that consumer spending remains resilient. The contrasting data sent mixed signals about the health of the U.S. economy, prompting a more cautious positioning among market participants.
Beyond the macro backdrop, geopolitical tensions also added to market uncertainty. The U.S. announced a new 10% tariff on select imports from China earlier this month, prompting a swift retaliatory response from Beijing. This reignited fears over U.S.-China trade frictions and further weighed on global economic outlook, fueling demand for defensive plays like gold.
From a technical perspective, gold has been in an uptrend since the start of the month, rebounding strongly from the $2,970 level. The four-hour chart shows solid support around $3,240, where a bullish hammer candlestick pattern has formed—typically a sign of continued upside after a brief pullback. On the daily time frame, the 50-day moving average has crossed above the 200-day, forming a bullish “golden cross.” However, the RSI has eased slightly from overbought territory and now sits between 60 and 65, suggesting the rally may be due for a pause or consolidation.
Looking ahead, whether gold can push to new highs will depend on how investors interpret the pace of the U.S. slowdown and how geopolitical events unfold. Holding above $3,340 opens the door to a potential test of the key $3,500 level. On the downside, a break below $3,240 could see prices retreat to around $3,100.
In the near term, all eyes will be on the upcoming U.S. initial jobless claims data—closely watched as a gauge of labor market strength. In addition, Federal Reserve Chair Jerome Powell is scheduled to speak this week, and markets will be listening carefully for any dovish tones that could impact rate expectations and, in turn, gold prices. Developments in U.S.-China trade negotiations may also influence the path forward.
On the institutional side, central banks continue to increase their gold holdings. Notably, the People’s Bank of China has boosted reserves for five consecutive months, lending fundamental support to gold prices over the medium to long term. In the options market, bullish bets have been rising, while implied volatility on gold options has hit a yearly high. This suggests market participants are bracing for bigger price swings, and interest in gold remains elevated.