


 |
| Gold V.1.3.1 signal Telegram Channel (English) |
EURUSD-1 hour
2025-07-21 @ 22:25
Market Overview
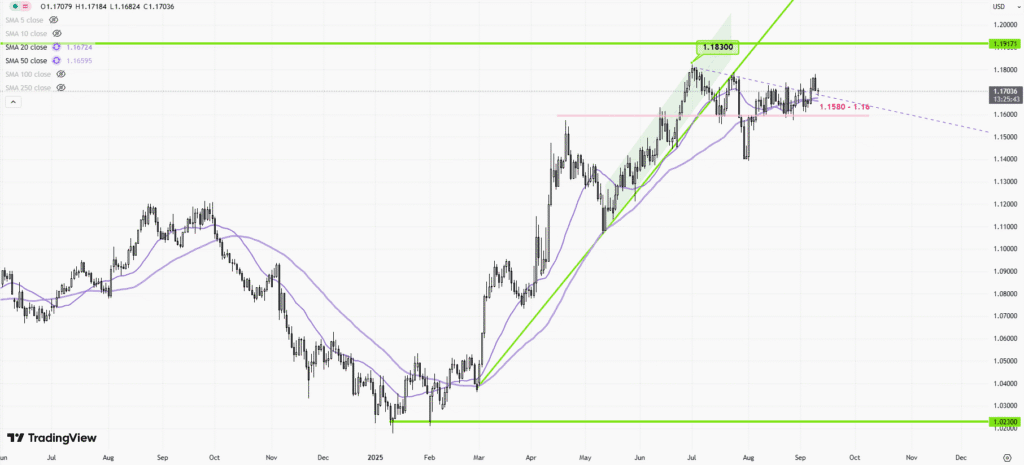
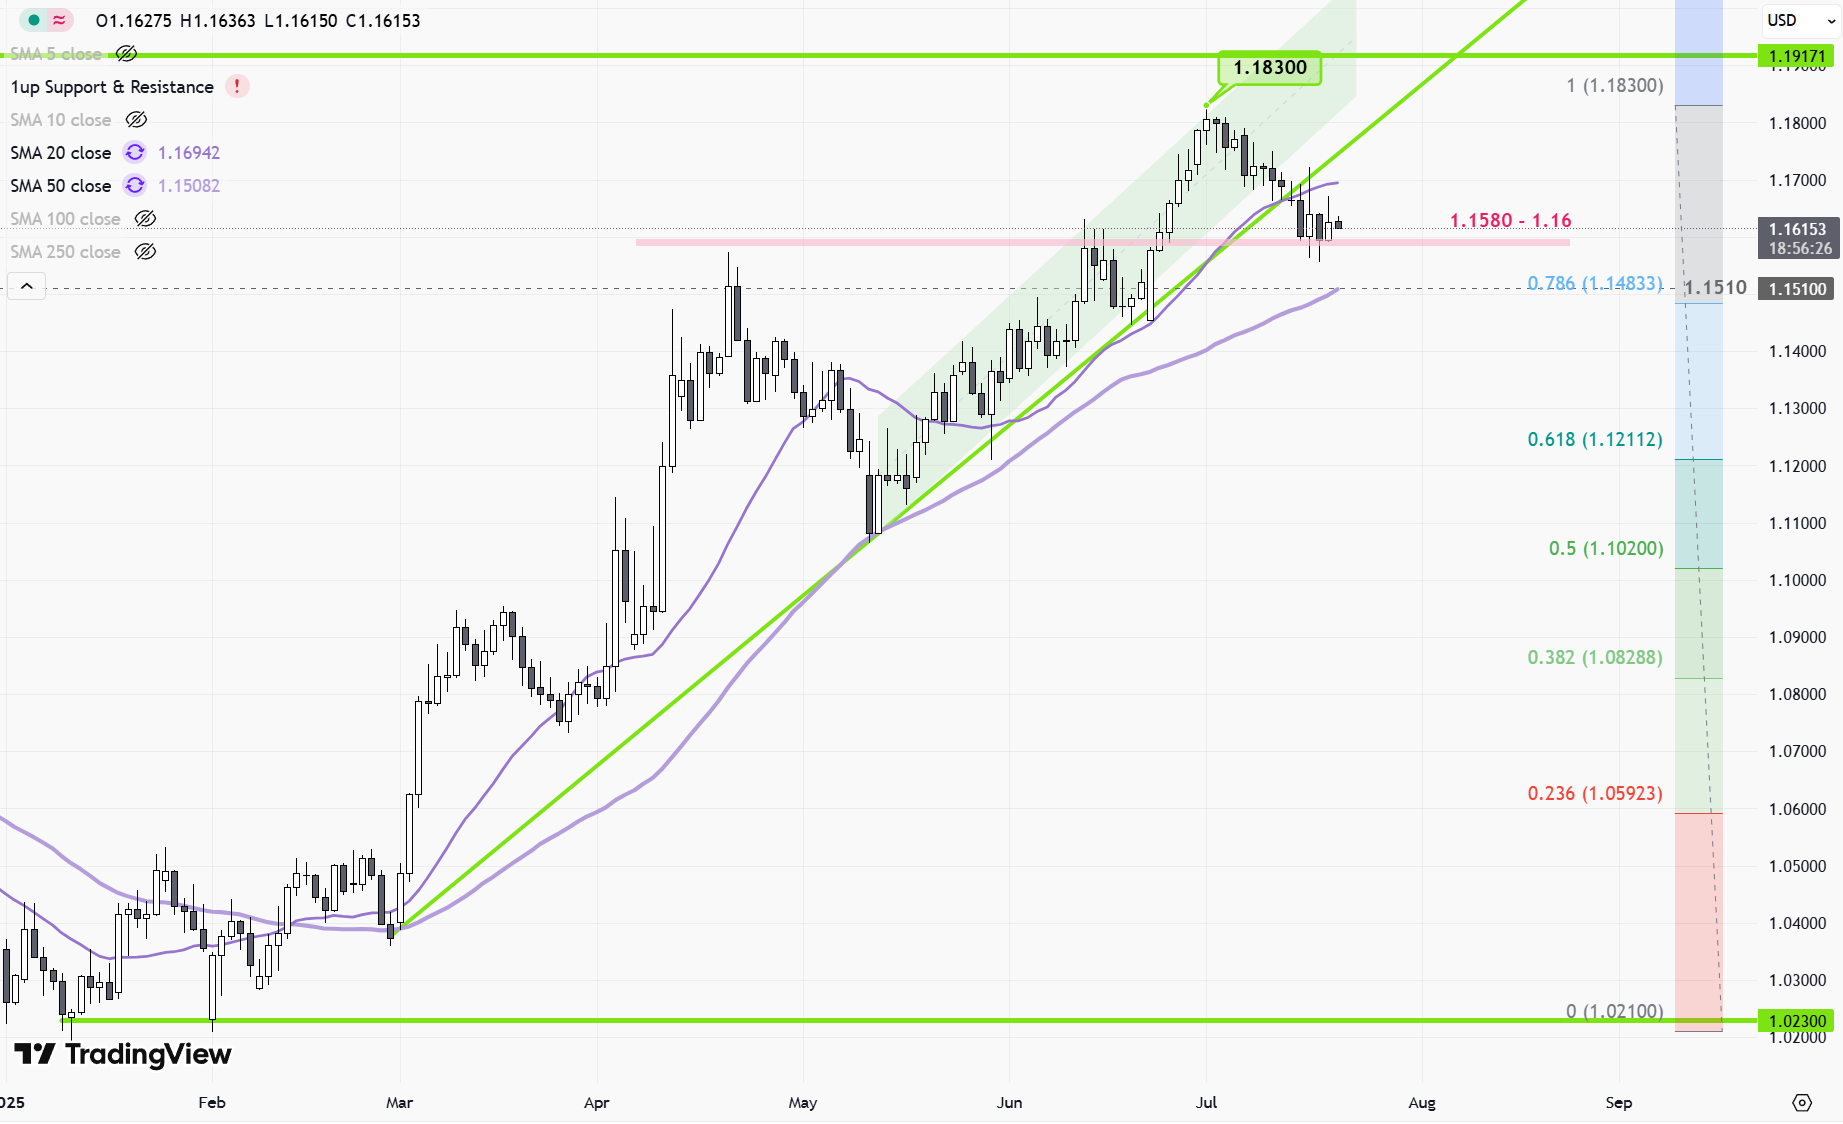
EURUSD traded lower over the past week, retreating from recent highs above 1.18 to near 1.17 as the pair corrected after breaking a technical channel in early July. The pullback coincided with renewed strength in the US dollar, which found support above the key 97.70 level in the Dollar Index. Market participants were cautious ahead of US inflation data and closely watched political developments impacting US policy. Despite the recent dip, overall volatility has remained moderate and technical signals, such as a bearish MACD crossover and RSI softening, point to potential further downside with key EURUSD support levels at 1.1658 and 1.1575. The ongoing trend is driven by shifting rate expectations, economic data surprises, and evolving political headlines.
EUR/USD 1-Hour Candlestick Chart Technical Analysis (as of July 21, 2025)
Current Indicators and Their Interpretations
– While the exact chart image is unavailable here, prevailing technical readings for EUR/USD suggest a bearish bias near 1.1625, with momentum indicators and moving averages likely tilted downward.
– Visible or implied moving averages (such as the 50 or 200-period) are probably above the current trading price, indicating continued downside pressure.
– RSI (Relative Strength Index), if observable, may be near or entering oversold territory, given the recent decline, potentially hinting at a short-term pause or a bounce if the oversold level is breached.
– No explicit reference to MACD or Bollinger Bands in the cited analysis, but decreasing volatility and trend strength are implied.
Chart Patterns and Price Structure
– The EUR/USD has recently broken the 1.1600 support and touched down to 1.1556, pushing into lower support territory.
– The structure is consistent with a counter-bearish channel, with price oscillating within a downward-sloping range.
– There is no strong evidence in recent price action of classical reversal patterns (such as double bottoms or head and shoulders), but the potential for an impulse wave completion is noted, which could set up for a corrective rise in the near term.
– Wave theory suggests a potential for corrective or consolidation phases following the completion of the latest downward move.
Candlestick Patterns
– Multiple tests of the 1.1572-1.1580 zone have failed to close decisively lower, possibly forming hammer or doji patterns at these lows—signs of demand or indecision.
– If price action exhibited long lower wicks or repeated rejection of new lows, this bolsters the scenario for a short-term bounce.
– Recent strong-bodied candles moving lower reflect prevailing bearish sentiment, but the emergence of reversal candles (if visible) would warrant attention for a potential rotational move.
Trend Assessment
– The current trend is down: lower highs and lower lows dominate, reinforced by the sequence of supports being broken and a lack of bullish follow-through.
– Price action evidences short-term downside momentum, though the developing corrective sequence could induce a brief sideways or upward retracement before the primary trend resumes.
Major Support and Resistance Levels
– Key Supports:
– 1.1580 (recently tested)
– 1.1556/1.1520 (next critical downside target)
– 1.1500, and further out, 1.1440
– Key Resistances:
– 1.1670 (first ceiling on rebounds)
– 1.1730 (upper bound of the latest bearish channel)
– 1.1800 (major structural resistance and reversal threshold)
Other Notable Technical Insights
– Momentum is weak, weighed down by broad dollar strength and macro headwinds, but the potential for a corrective wave is emerging based on wave structure and repeated low tests.
– Volume trends, if available, might show declining sell pressure as price nears key supports; increasing volume on reversal attempts would confirm a higher probability for a corrective rally.
– The external environment—particularly recent Fed comments and trade war headlines—continues to impact short-term volatility and trader sentiment.
Actionable Technical Outlook Summary
The EUR/USD remains in a pronounced short-term downtrend, targeting further losses toward 1.1520 and possibly 1.1500 unless the pair can stage a convincing rally above 1.1670. Repeated support tests and emerging reversal candles could instigate a corrective bounce toward the 1.1670 level, but until prices reclaim and hold above this key resistance, sellers retain control. Short trades on rallies toward resistance and cautious buy attempts at confirmed support bounces are likely the favored strategies under current market conditions. Traders should closely monitor price behavior at 1.1520 for signs of exhaustion or reversal to capitalize on any imminent corrective moves.