


 |
| Gold V.1.3.1 signal Telegram Channel (English) |
XAUUSD-1 hour
2025-07-22 @ 11:27
Market Overview
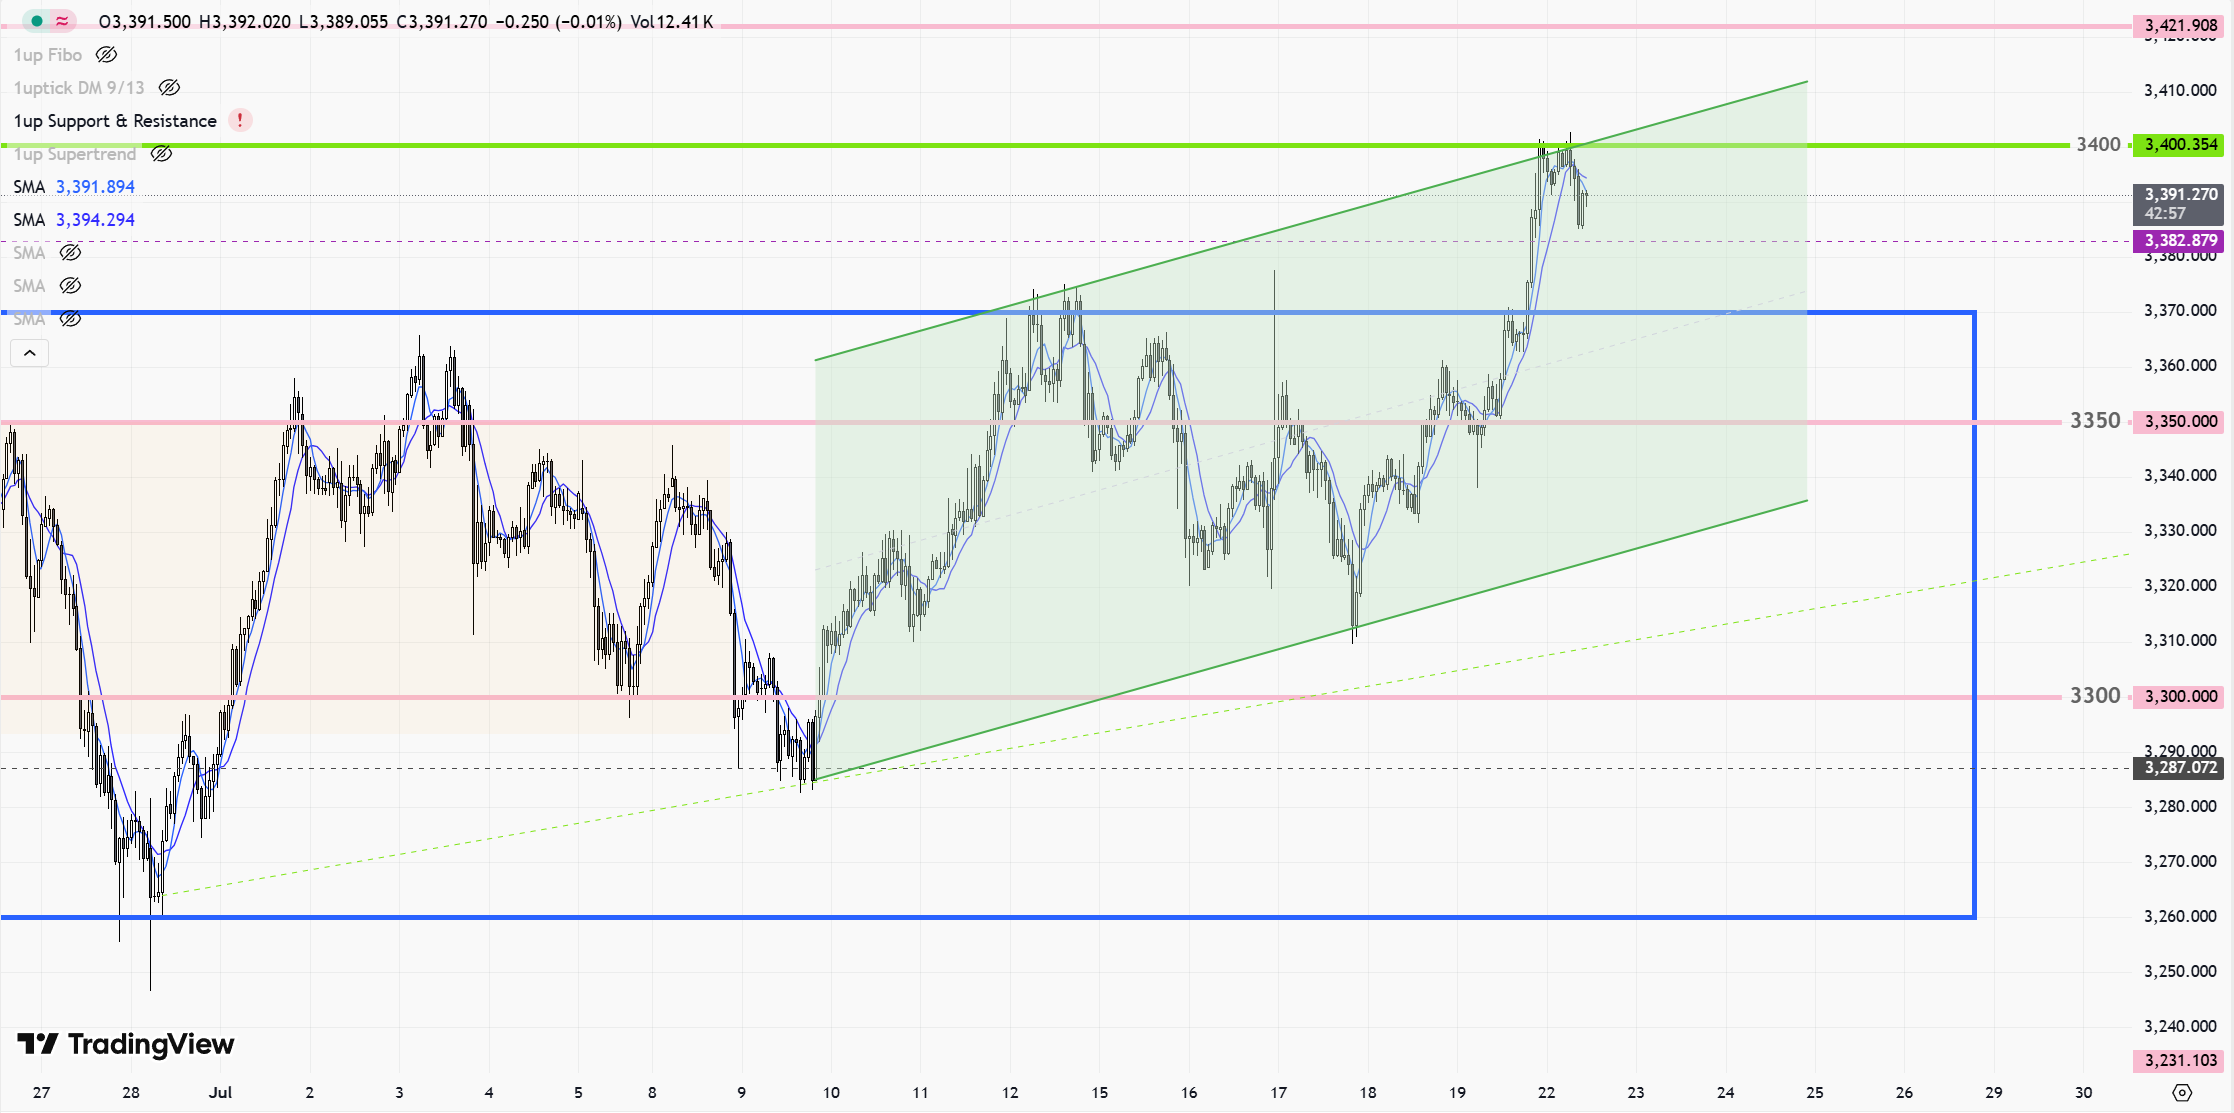
Over the past week, XAUUSD (Gold) experienced modest fluctuations, closing near $3,390 per ounce but showing a slight downward trend in the last couple of days. The price movements were influenced by a softening US dollar, ongoing geopolitical tensions, and cautious investor sentiment ahead of key economic data releases. Central bank demand has remained a significant driver, underpinning gold’s status as a safe-haven asset. Additionally, geopolitical risks such as tensions in the Middle East and forthcoming US tariffs have reinforced investor interest. Technically, gold showed resilience with bullish momentum on daily and weekly charts, maintaining support levels around $3,100 and resistance near $3,135. Despite minor short-term dips, the outlook remains positive as gold continues to benefit from inflation concerns, global economic uncertainties, and strong industrial demand for related metals.
XAUUSD 1-Hour Chart Technical Analysis
Technical Indicators
- Moving Averages: The 50-period and 200-period moving averages appear flat and closely aligned, indicating a lack of strong trending momentum. This convergence suggests a balanced state between buyers and sellers, with no decisive trend currently dominating price action.
- RSI (Relative Strength Index): RSI readings remain near the midpoint, reflecting the absence of clear overbought or oversold conditions. This supports the view of continued consolidation, with neither bullish nor bearish extremes evident.
- MACD (Moving Average Convergence Divergence): The MACD oscillator is hovering around the zero line, with minimal divergence between its signal lines. This further confirms the market’s neutral stance and lack of directional conviction.
- Bollinger Bands: Price action is oscillating within a tight Bollinger Band range, which has compressed to levels not seen in months. This compression often precedes a period of heightened volatility or a breakout from the current range.
Chart Patterns
- The chart exhibits the formation of a contracting triangle pattern, defined by trendlines that are connecting higher lows and lower highs. Both the upper and lower trendlines have been tested multiple times, underscoring the reliability of this structure.
- The broader price action since April remains mostly sideways, suggesting the market is in the latter stages of consolidation within this triangle. The next significant move is likely to coincide with a breakout from this formation.
Candlestick Patterns
- Recent sessions have seen the appearance of Hammer candlesticks near the lower Bollinger Band. This is typically a bullish reversal signal, implying buying interest is emerging at lower levels and supporting the potential for an upward move.
- No pronounced bearish engulfing, doji, or shooting star patterns are dominating recent sessions, further emphasizing a lack of exhaustive selling or buying.
Trend Assessment
- Current Direction: The product remains in sideways consolidation within a well-defined range. There is no clear dominant uptrend or downtrend at the moment.
- Momentum: Bearish momentum from prior declines appears to be waning, with stabilization and mild bullish bias returning, as evidenced by the response at key supports.
Support and Resistance Levels
- Major Support: 3,300–3,319 zone, repeatedly tested, marks a strong demand area where buyers have consistently stepped in.
- Major Resistance: 3,360–3,415 range serves as the primary overhead resistance, with upper bounds near 3,435 and 3,500 as the next upside targets if a breakout occurs.
- These levels define the borders of the current consolidation and serve as critical reference points for breakout or breakdown scenarios.
Additional Technical Insights
- Volatility is unusually compressed, as indicated by the narrow Bollinger Bands. Markets typically experience expansion in volatility following prolonged periods of contraction, suggesting a significant price move is likely imminent.
- Volume and Momentum: While volume data isn’t directly visible in the attached chart, the squeeze in Bollinger Bands and sideways consolidation typically signal waning participation and may precede a volatility event on a breakout.
Actionable Summary
Gold (XAUUSD) is currently trading in a sideways consolidation phase within a contracting triangle, supported by flat moving averages, neutral RSI, and MACD signals, as well as tight Bollinger Bands. A hammer candlestick at recent support implies early bullish interest, but overall momentum remains muted until a decisive breakout occurs. Watch the 3,300–3,319 support and 3,360–3,415 resistance for any moves outside this range, which could signal an impulsive directional trend and provide new trading opportunities. Traders should remain patient and look for confirmed breakouts above resistance for bullish exposure or breakdowns below support for bearish setups, as a volatility expansion appears likely in the near term.