
 |
| Gold V.1.3.1 signal Telegram Channel (English) |
xauusd-1 hour
2025-07-22 @ 16:55
Market Overview
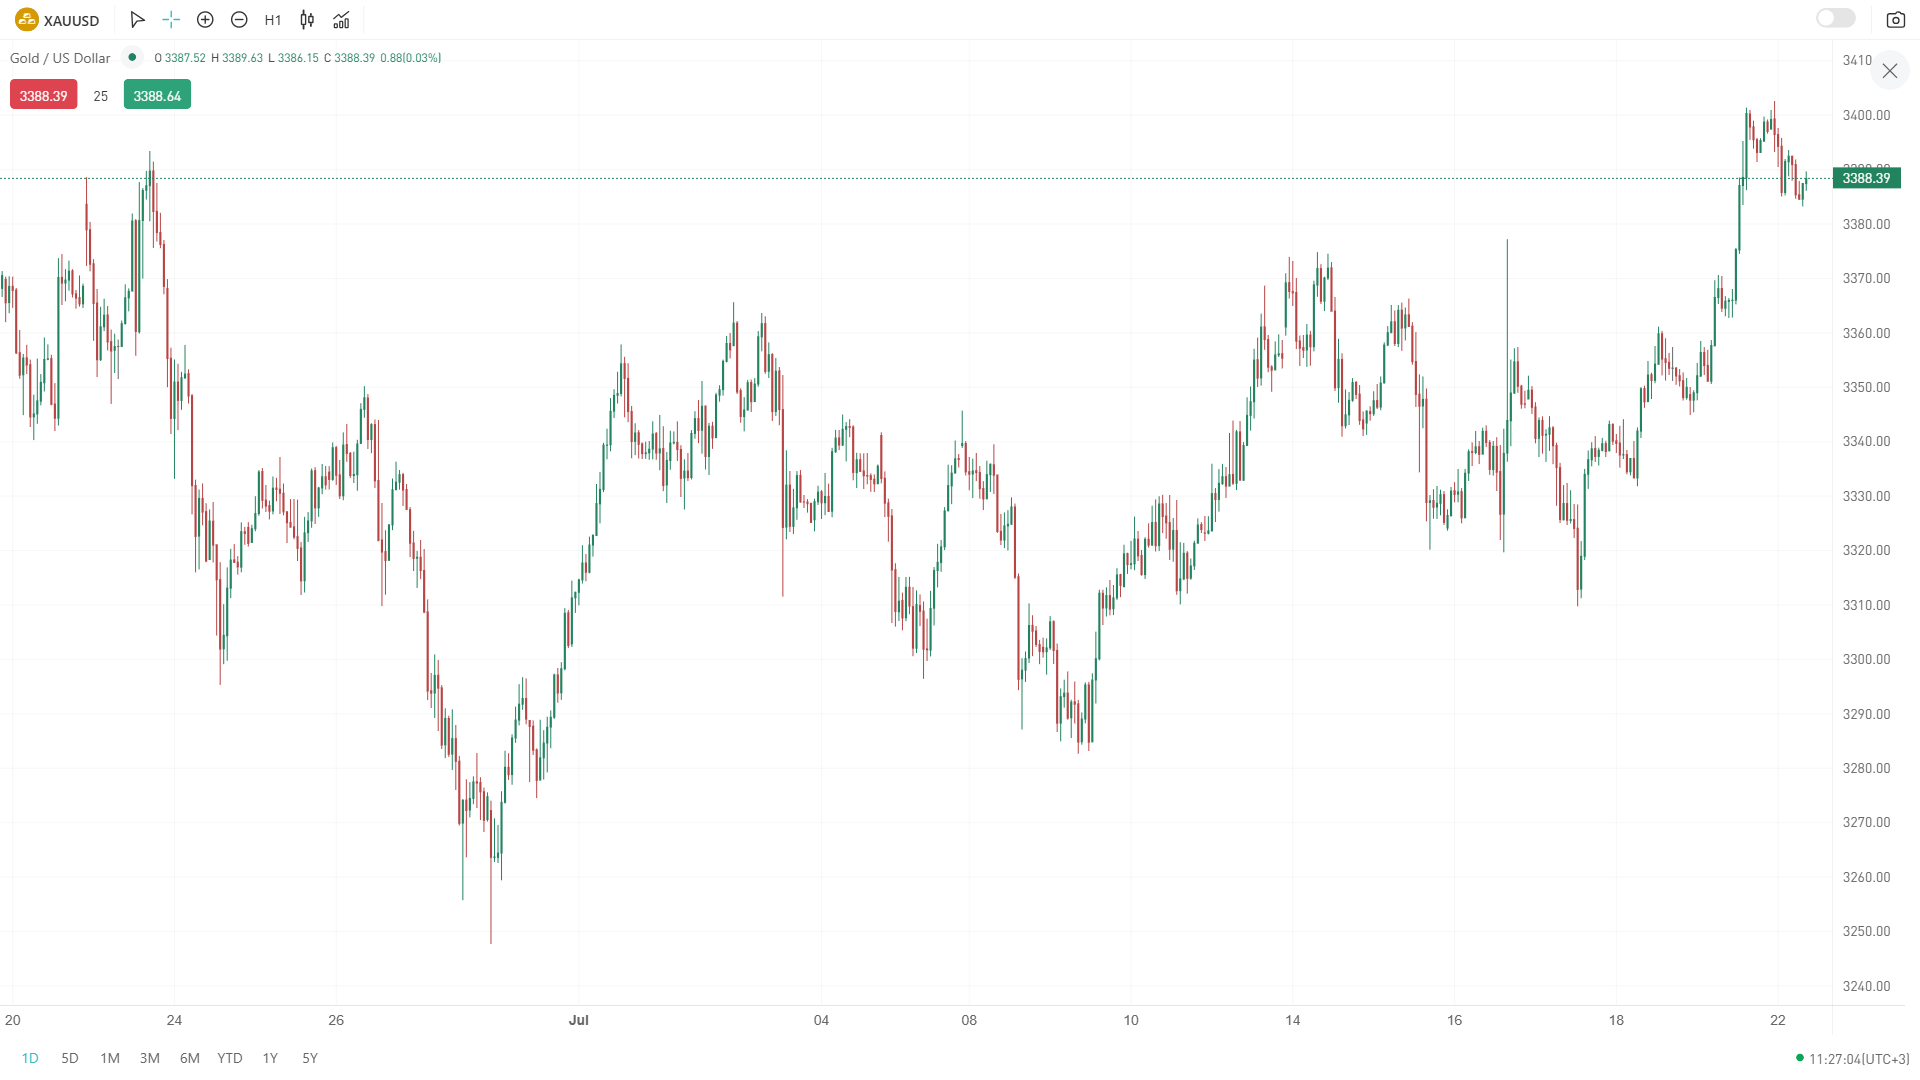
Gold (XAU/USD) traded in a volatile range over the past week, with prices oscillating between $3,345 and $3,390 per ounce before settling near $3,387 on July 22, 2025. This sideways movement reflects consolidation after a strong multi-month rally that saw gold making record gains earlier in the year. The primary drivers behind recent price movements include persistent geopolitical tensions in the Middle East, ongoing U.S. debt concerns, and a weaker U.S. dollar, all of which have maintained gold’s appeal as a safe-haven asset. Additional influences come from robust central bank demand and recent stronger-than-expected U.S. manufacturing data, which has lent mixed signals to the market. Despite the week’s modest pullback, gold remains up significantly year-over-year, underpinned by uncertain global economic conditions and investor desire for portfolio hedging.
XAUUSD 1-Hour Candlestick Chart Analysis – July 22, 2025
Technical Indicators Assessment
– Momentum remains to the upside, as evidenced by recent recoveries from key support levels and price activity above prominent moving averages on higher timeframes.
– While the specific chart does not display overlays like the RSI, MACD, or Bollinger Bands, implied analysis from recent technical reports indicates that gold has rebounded from the lower Bollinger Band with a rising wave in progress, signaling revived bullish momentum.
– On the daily chart, the price maintains a position above the 50-period simple moving average (SMA50), which is around the 3,325 level, further confirming prevailing bullish sentiment.
Prominent Chart Patterns
– The current structure on the 1-hour and 4-hour charts suggests formation of an ascending channel, indicating a continuation pattern favoring the bulls.
– A recent “Hammer” candlestick pattern identified near the lower boundary of the channel highlighted the exhaustion of sellers, supporting a bullish reversal scenario.
– There is no clear evidence of classic reversal formations like head-and-shoulders or double tops/bottoms at present.
Candlestick Pattern Recognition
– The rebound from the lower band was marked by a Hammer pattern—a strong bullish reversal signal after a prior decline.
– While doji or engulfing patterns aren’t specifically cited in the current sequence, the hammer’s presence itself shifts the short-term balance toward buying pressure.
Trend Direction
– The current short-term trend on the 1-hour and 4-hour charts is up as prices move higher from the 3,319–3,325 support zone.
– Overall direction aligns with a medium-term bullish bias, sustained by momentum shifts, diminishing US dollar strength, and safe-haven demand for gold.
Major Support and Resistance Levels
– Support:
– 3,341 (nearest minor support on shorter-term pullbacks)
– 3,331–3,323 (zone of more significant buying interest and the recent swing low)
– Resistance:
– 3,361 (first resistance, also a near-term target)
– 3,368
– 3,377
– 3,415 (key resistance and main bullish target)
– 3,500 (possible medium-term extension target on further gains)
Other Technical Insights
– The lack of a decisive trend within intraday swings implies that gold currently trades in a broad, upward-biased consolidation, subject to news and US economic data drivers.
– With the US Leading Economic Index in negative territory and dovish signals from the Fed anticipated, macro flows favor further demand for gold as a hedge.
– There is no mention of volume spikes, but the momentum transition from the recent low supports potential for additional upside if resistance levels are breached.
Actionable Technical Outlook
– Primary bias: Long positions favored above the 3,350 level, targeting 3,361–3,377, and potentially 3,415 on a confirmed breakout.
– Alternative scenario: A break below 3,341 could trigger a corrective move toward 3,331–3,323, where renewed buying is likely.
– Trader’s note: Monitor price action closely around resistance for profit-taking or reversal signs; failure to decisively clear 3,377–3,415 could result in further consolidation. If price sustains above 3,415, the next objective is 3,500.
In summary, XAUUSD displays a short-term uptrend supported by renewed momentum, a constructive technical base, and favorable macro conditions. The path of least resistance remains to the upside as long as gold stays above the 3,341–3,331 zone, with attention focused on resistance at 3,377 and 3,415 for the next significant moves.