


 |
| Gold V.1.3.1 signal Telegram Channel (English) |
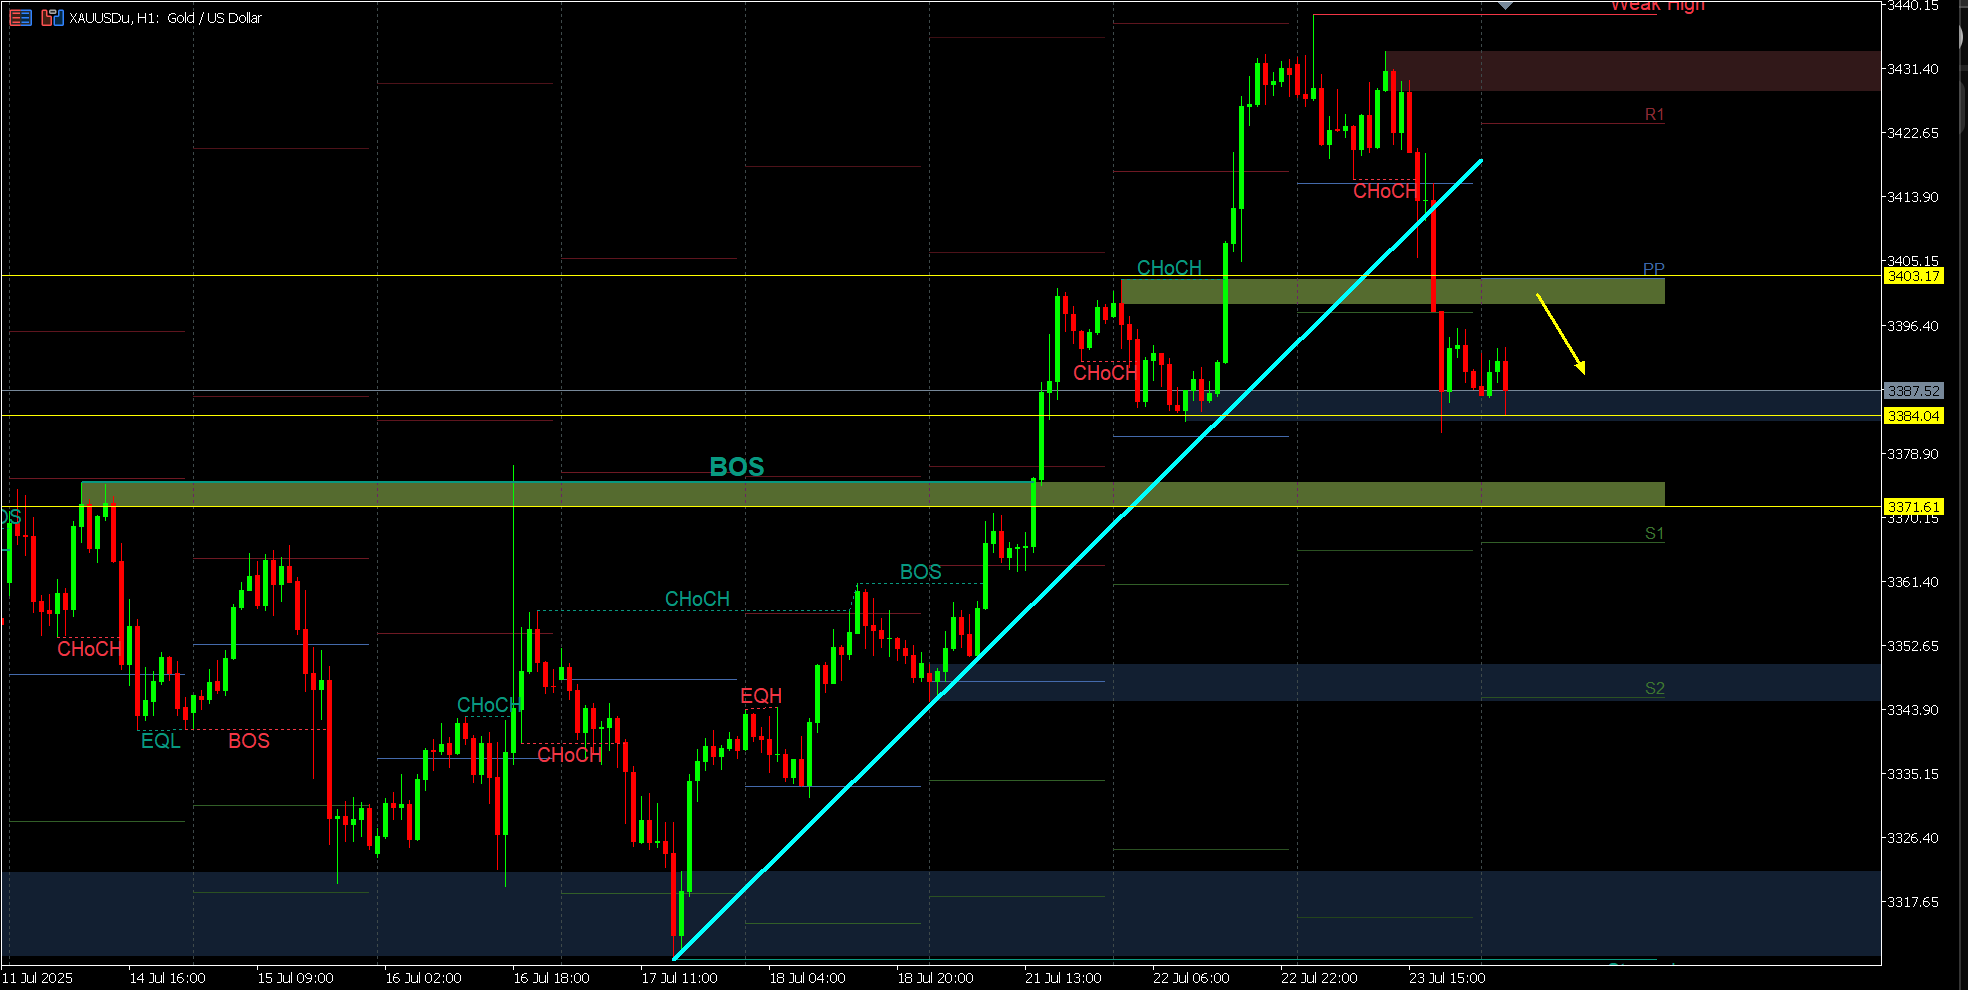
XAUUSD-1 hour
2025-07-24 @ 10:03
Market Overview
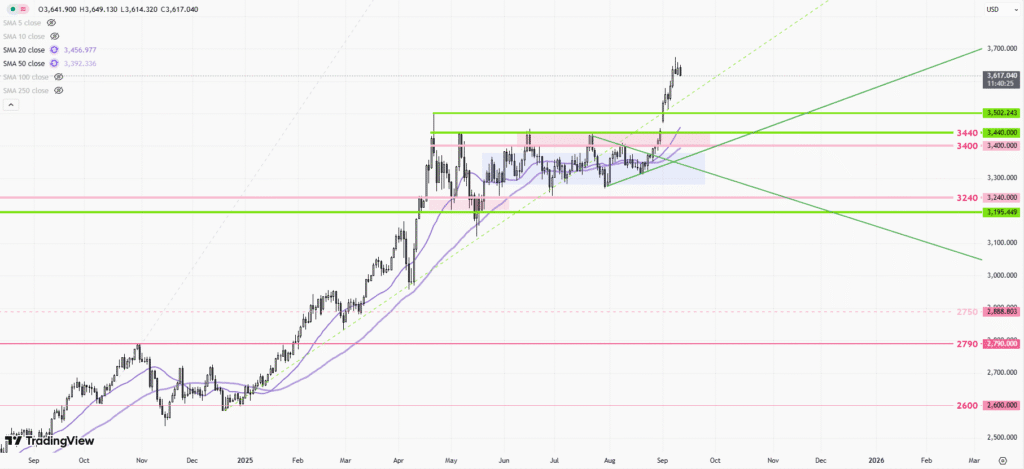
Gold (XAUUSD) experienced notable volatility this past week, climbing from support near 3,319 USD to reach a high around 3,439 USD before retreating slightly and stabilizing near 3,423 USD. This bullish momentum was initially driven by a weaker US dollar and dovish signals from the Federal Reserve, heightening expectations of policy easing. However, optimism surrounding new US trade agreements and positive tariff news triggered a corrective pullback, as traders weighed reduced safe-haven demand. Other influential factors included ongoing US economic weakness, persistent uncertainty in global markets, and continued geopolitical tensions, all of which lent support to gold as a hedge. Looking ahead, the overall trend remains bullish, with short-term consolidation or corrections possible before another upward push.
XAUUSD 1-Hour Chart Technical Analysis
Technical Indicators and Signals
– Price action is firmly trading above both the short-term (20-period) and long-term (200-period) moving averages, indicating a strong bullish trend. The rising 20MA is closely following price, acting as dynamic support, while the 200MA near the $3350 level provides a robust mid-term support level.
– The MACD shows its main line positioned above the signal line, and the histogram is sustained in positive territory. This classic momentum continuation setup reinforces the bullish outlook and suggests continued buyer control.
– There is insufficient visibility on actual RSI or Bollinger Bands from the image, but implied momentum and recent upward volatility are consistent with an overbought or strongly trending market phase.
Chart Patterns
– The market displays a classic bullish structure with higher highs and higher lows, further strengthening the uptrend bias.
– Recent commentary and analysis highlight the completion of a medium-term triangle pattern (an ascending formation) and a successful breakout, confirming upward momentum. The triangle’s completion typically projects continuation in the direction of the breakout, which in this context is upward.
– On larger hourly structures, multiple tests of consolidation resistance and dynamic support underscore robust technical structure.
Candlestick Patterns
– Visible candlestick arrangements reveal several bullish continuation and reversal signals, including bullish engulfing candles and hammer formations near pullbacks, intimating persistent demand and dip-buying activity.
– Occasional appearance of smaller-bodied candles (doji or spinning tops) following sharp moves suggests intermittent pauses or minor indecision, but without strong evidence of a reversal at this time.
Current Trend Direction
– The overall trend is strongly up, validated by sequential higher highs/higher lows, position above moving averages, and positive momentum. There is no clear sign of a sustainable reversal or transition to sideways consolidation as per the latest price swings.
Support and Resistance Levels
– Major support: $3350 (aligned with the 200MA), and old breakout zones around $3380–$3400.
– Major resistance: The $3430–$3440 range, as this level has capped recent advances and marks the upper bound of the latest wave projection; also cited in multiple technical commentaries as an area of strong seller interest.
Additional Technical Insights
– Momentum remains strong, but as prices approach the $3430–$3440 resistance zone, the risk of short-term pullbacks or profit-taking increases, especially as the uptrend enters potential overbought territory.
– No significant bearish divergences are visible, and the absences of deep retracements reinforce the prevailing bullish sentiment.
– Volume trends are not visible on the currently provided chart, but broad price extension and minimal retracement are indicative of healthy buying interest.
Actionable Summary
– XAUUSD remains firmly in a bullish uptrend on the 1-hour time frame, with price action consistently above short- and long-term moving averages and backed by positive momentum signals.
– Buyers remain in control, targeting a potential breakout above the $3430–$3440 resistance zone. Any retracement back toward $3380–$3400 is likely to attract renewed buying interest, as long as the price holds above the $3350 support base.
– Traders should watch for any loss of momentum or reversal candlestick patterns near resistance, which could signal a pause or short-term correction within the broader trend.
– Risk management is especially important at current levels, as upside extensions often see increased volatility and two-way trade.
– The technical bias remains bullish until clear evidence of trend exhaustion or break of major support emerges.