


 |
| Gold V.1.3.1 signal Telegram Channel (English) |
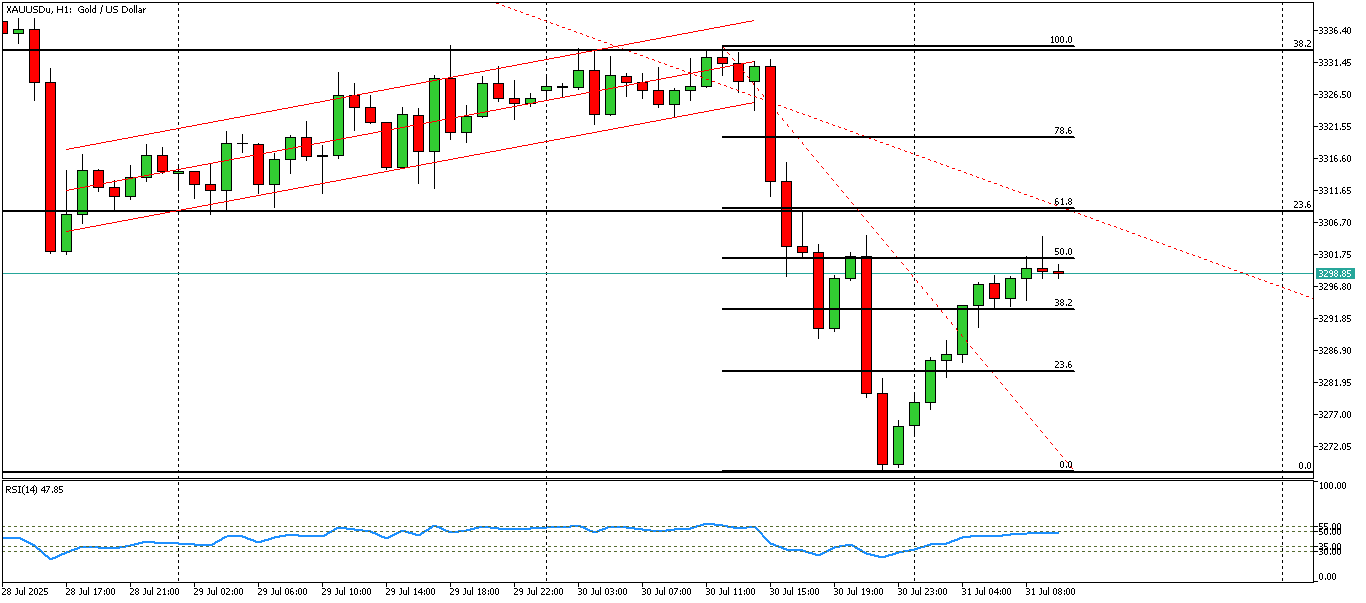
XAUUSD-1 hour
2025-07-31 @ 15:07
Market Overview
Gold (XAUUSD) traded in a narrow range this past week, hovering near $3,300 per ounce, with no decisive trend. Despite this, the overall momentum remains slightly bullish, as the price gradually rebounded from recent lows after earlier weakness. Factors behind this movement include persistent concerns over the US economy, ongoing geopolitical tensions in the Middle East, and worries about US debt levels, which continue to support gold’s role as a safe-haven asset. Market sentiment remains cautious with traders split on direction, reflecting broader uncertainty. Technical levels to watch include support at $3,328 and resistance at $3,345. Overall, gold stays resilient amid mixed macroeconomic signals and fluctuating risk appetite in global markets.
Gold (XAUUSD) has recently entered a pronounced downtrend on the 1-hour chart, characterized by persistent lower highs and lower lows following a breakdown below major support. Here is a detailed technical analysis:
Technical Indicators and Their Signals
- Moving Averages: Both the short-term (20 EMA) and mid-term (50 EMA) moving averages are sloping downward, with price notably trading below both. The 20 EMA is converging toward the 200 SMA, indicating a potential “death cross,” which is traditionally a bearish signal and implies the continuation of downside momentum.
- MACD: The MACD line has crossed below its signal line, and the histogram is expanding further into negative territory. This reaffirms sustained bearish momentum with little sign of immediate reversal.
- RSI: The Relative Strength Index is hovering between 30 and 35. While not yet deeply oversold, a move below 30 would tip gold into oversold conditions, perhaps inciting a temporary technical bounce. Until then, the RSI supports the bearish outlook.
- ADX: With readings around 40, the Average Directional Index indicates a strong, well-established downtrend.
Chart Patterns
- The chart reveals a sequence of lower swing highs and lower swing lows. This price action reflects the definition of a downtrend and shows no classic reversal pattern currently in play.
- There are no prominent reversal patterns such as head and shoulders, double bottom, or wedges visible at this time. Instead, the continuation of bearish structure is clear.
Candlestick Patterns
- Instances of bearish candlestick signals—such as bearish engulfing patterns and long upper shadows—underscore persistent sell-side pressure.
- No significant bullish reversal candlestick formations (e.g., hammer, bullish engulfing, morning star) are present, which means reversal risk is, for now, limited.
Current Trend Direction
- The prevailing trend on the 1-hour chart is decisively down. All technical indicators and the sequence of price action reinforce this trend direction.
Major Support and Resistance Levels
- Support: The next notable support is identified at the $3,300 zone, an area where buying interest previously emerged. A break below this level could open downside to lower zones, likely around $3,269.
- Resistance: Immediate intraday resistance is found in the $3,416-$3,420 range—recent swing highs and prior significant price clusters. Only a decisive hourly close above this resistance would hint at a potential shift or deeper pullback.
Other Technical Insights
- The lack of significant bullish divergence in both price and oscillators confirms that bears remain in control.
- If volume is observable and expanding on downside breaks, it further confirms momentum behind the move, though 1-hour gold charts sometimes feature thin volume signals outside of major market hours.
- There is a potential for a minor corrective bounce (wave 4 as per Elliott Wave analysis), but this would be considered corrective and likely to be capped by the noted resistance before the prevailing downtrend resumes.
Actionable Summary
Gold (XAUUSD) is entrenched in a 1-hour downtrend, with all major technical indicators and chart structure suggesting further potential downside. Trend-following strategies remain favored below the $3,416-$3,420 resistance area, while next significant support sits near $3,300. Entering fresh shorts on minor pullbacks to resistance or breakdowns below support is technically justified, but caution is warranted for oversold conditions and the possibility of short-term rebounds. Bulls need to await substantial evidence of trend reversal before considering long exposures.