![[Daily Closing 🔔] Gold – Gold Prices Slip as Markets Await Key U.S. Economic Data Release](https://int.1uptick.com/wp-content/uploads/2025/04/2025-04-30T034839.563Z-file.jpeg)
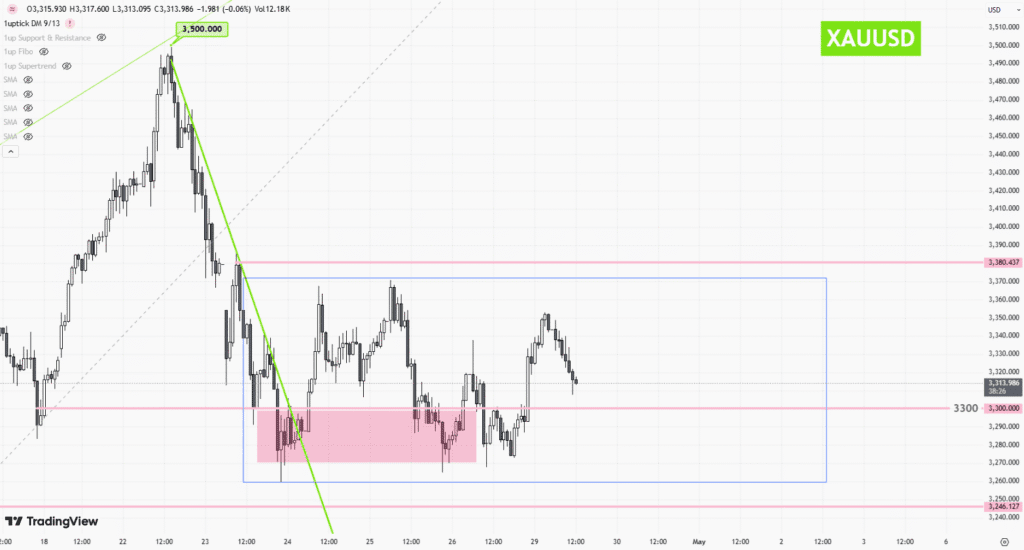
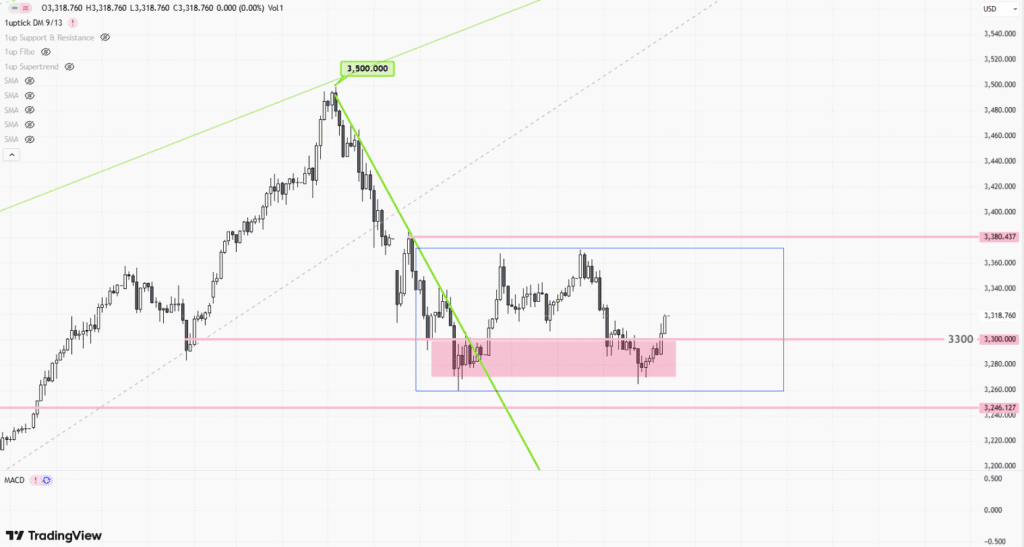
![[Gold price weekly] – Volatile Consolidation Driven by Multiple Factors](https://int.1uptick.com/wp-content/uploads/2025/04/2025-04-28T055444.196Z-file-1024x551.png)

 |
| Gold V.1.3.1 signal Telegram Channel (English) |
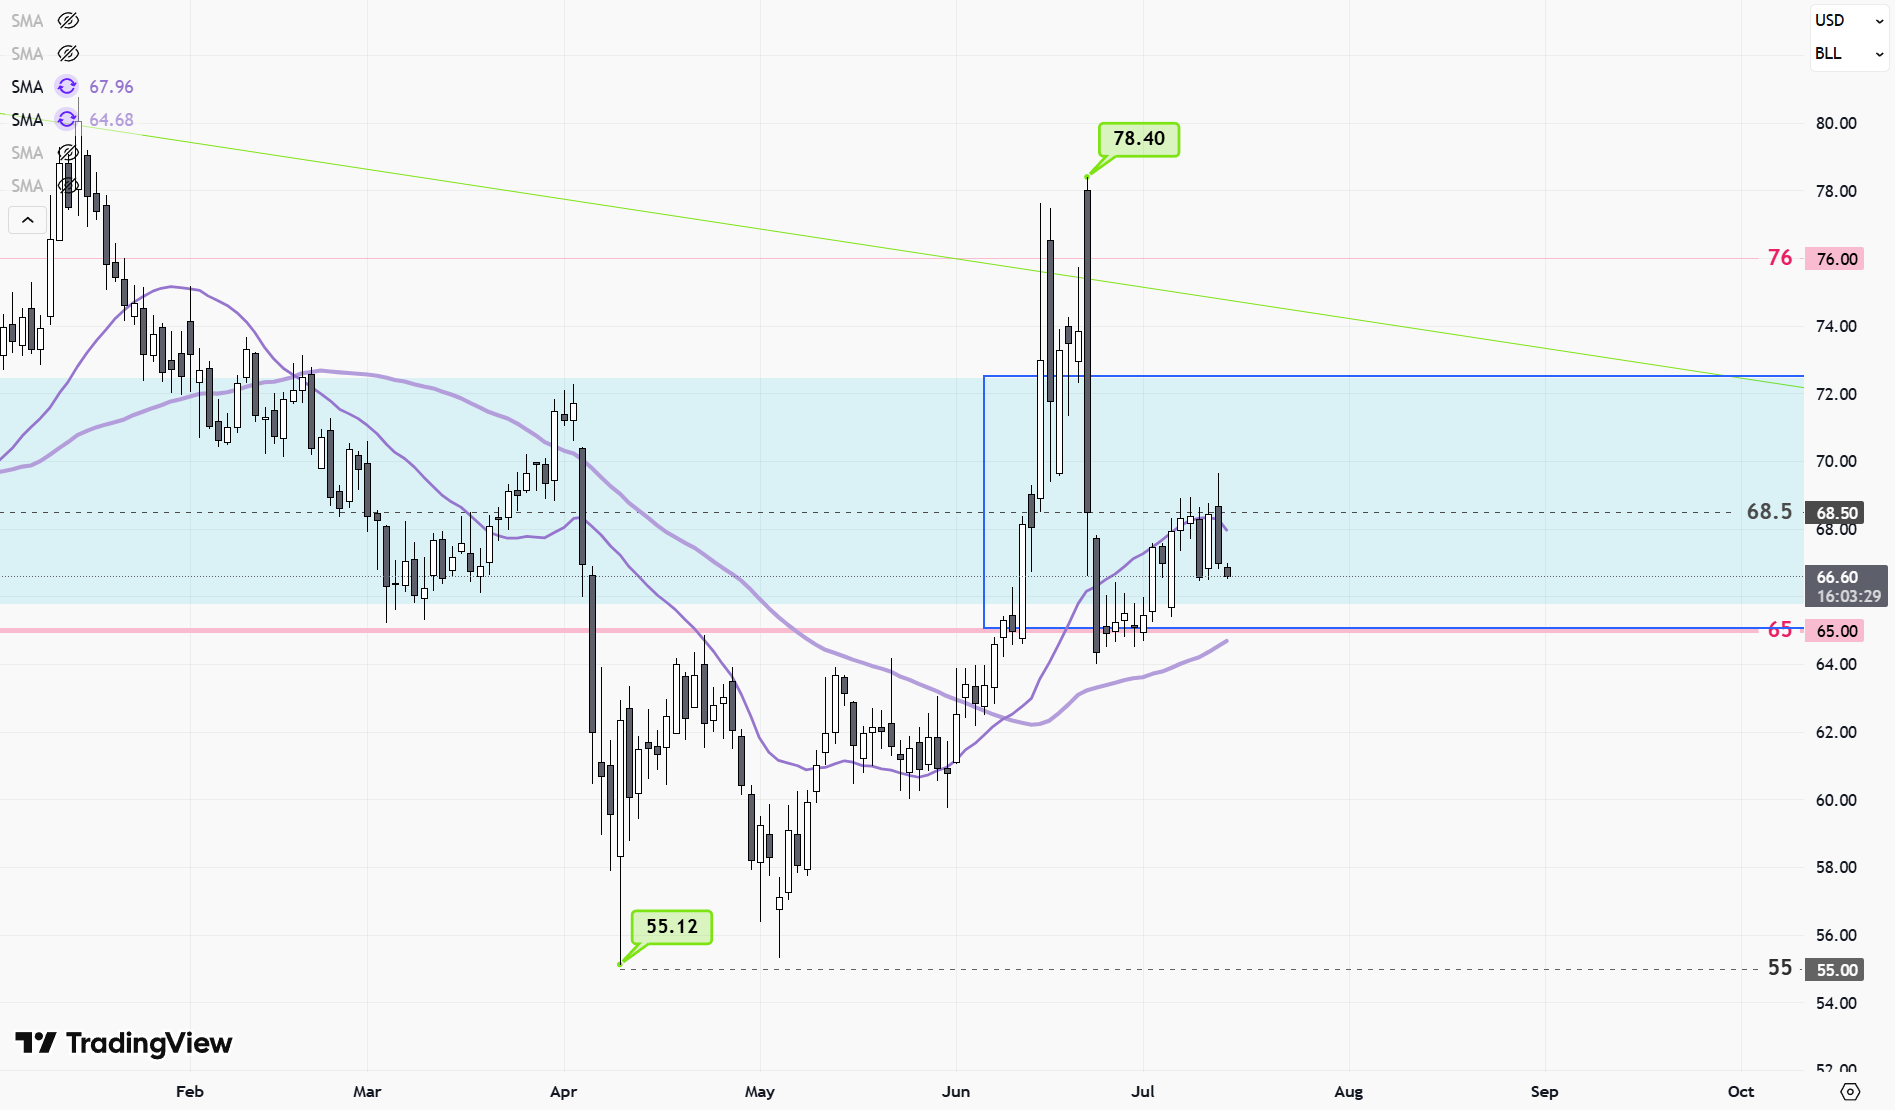
CLc1-Daily
2025-07-15 @ 13:07
https://int.1uptick.com/wp-content/uploads/2025/07/Commodities-CLc1-Daily-2025-07-15T120718.0390700.png”
Market Overview
Over the past week, CLc1 (WTI Crude Oil Futures) experienced notable volatility, with prices fluctuating from below $67 to around $68.50 per barrel. The market was driven by several key factors, including ongoing concerns over global supply disruptions and shifting demand forecasts tied to economic data. Renewed geopolitical tensions in major oil-producing regions contributed to risk premiums, while recent macroeconomic signals in the US and China impacted demand sentiment. Additionally, inventory reports indicated lower-than-expected crude stockpiles, which added upward pressure to prices. Overall, the combination of geopolitical risks, dynamic demand projections, and inventory surprises shaped the recent movement in CLc1, keeping traders alert to further market developments.
Analyzing the daily candlestick chart of CLc1 (WTI Crude Oil Futures) as of mid-July 2025 reveals the following detailed insights:
Technical Indicators and Their Signals
- Moving Averages: The price is currently trading around $68, just below the 200-day moving average near $68.4, which is acting as immediate resistance. The 50-day moving average near $64.2 provides a strong dynamic support level below current prices. This structure places crude oil in a range bounded by these two key averages.
- RSI: The Relative Strength Index is approximately neutral (around 44 to 45), suggesting neither strong bullish nor bearish momentum at present.
- MACD: The MACD indicator is in a slight sell signal mode, indicating limited bullish momentum in the near term.
- Stochastic Oscillators: These are leaning toward a sell condition, reinforcing the cautious technical stance.
- ADX: The Average Directional Index is relatively low (~18), indicating weak trend strength, consistent with sideways or range-bound conditions.
- Volume and Open Interest: Moderate volume with open interest stable suggests ongoing trader participation but not an overwhelming trend conviction.
Candlestick and Chart Patterns
- The chart shows a sequence of mixed candlestick types without a decisive breakout candle. Notably, recent candlesticks show some indecision, with a few doji-like patterns illustrating market hesitation.
- There is no clear evidence of strong reversal patterns such as a head and shoulders, double top, or bottom.
- The price action is oscillating within a defined horizontal range, suggesting a sideways consolidation phase rather than a well-established trend.
Trend Direction
- Overall, the daily chart reflects a sideways consolidation after a prior volatile episode where prices briefly spiked above $75.
- The failure to sustain above $75 combined with support holding near $66–$68 indicates a battle between bulls and bears, with no clear dominance yet.
Support and Resistance Levels
- Major Support: The $66.00 to $68.00 zone acts as critical support, having held prices from falling further over several months.
- Immediate Resistance: The 200-day moving average near $68.40 serves as a key resistance level.
- Next Resistances: If price breaches above $69–70, then the $72.00 to $76.00 zone, which hosted previous spikes, would come into focus as the next major resistance band.
Additional Technical Insights
- The persistence of price in the $66–68 range despite recent volatility suggests a strong demand zone.
- The lack of strong momentum indicators and the relatively flat ADX reinforce the consolidation thesis.
- Momentum oscillators hint at cautious sentiment, signaling that traders should await a clear breakout or breakdown before committing heavily.
- Volume trends indicate stable engagement, supporting the scenario of a range-bound market rather than a fast-moving trend.
Actionable Summary
Crude Oil Futures (CLc1) are in a pivotal sideways consolidation phase bounded by strong multi-month support at $66–$68 and immediate resistance at the 200-day moving average near $68.40. Technical indicators reveal neutral to slightly bearish momentum without a defined trend, emphasizing range-bound trading conditions. Traders should closely watch for a convincing breakout above $69–70 to trigger a potential retest of higher resistance at $72–$76, which would signal renewed bullish strength. Conversely, a break below $66 would suggest downside acceleration. Until such decisive moves occur, adopting range discipline and managing risk prudently remains essential.