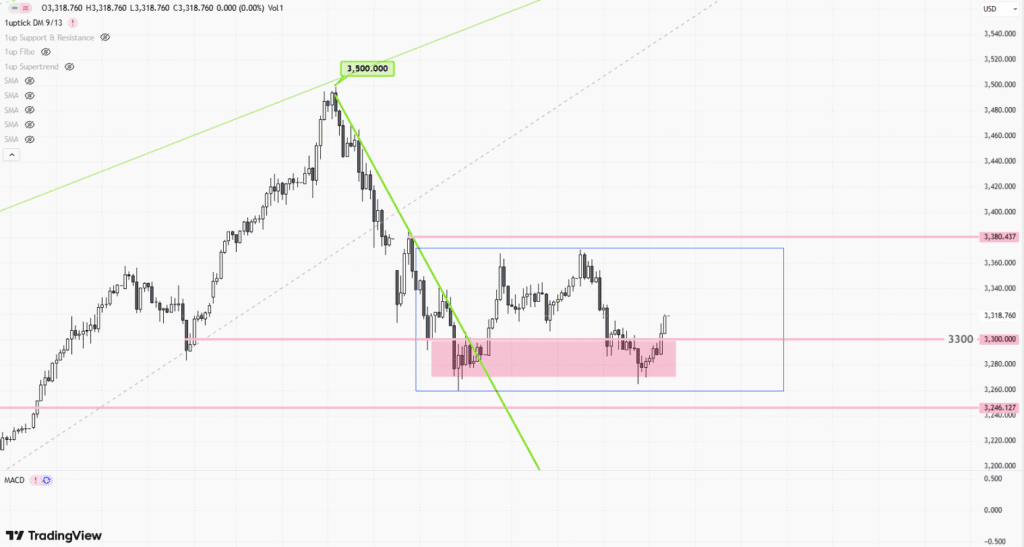
![[Daily Closing 🔔] Gold – Gold Prices Slip as Markets Await Key U.S. Economic Data Release](https://int.1uptick.com/wp-content/uploads/2025/04/2025-04-30T034839.563Z-file.jpeg)
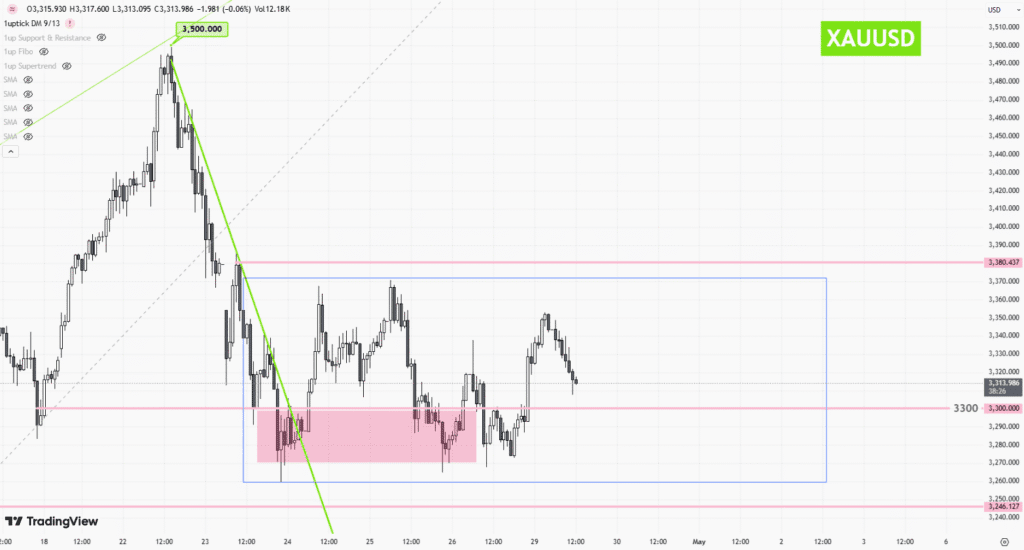
![[Gold price weekly] – Volatile Consolidation Driven by Multiple Factors](https://int.1uptick.com/wp-content/uploads/2025/04/2025-04-28T055444.196Z-file-1024x551.png)


 |
| Gold V.1.3.1 signal Telegram Channel (English) |
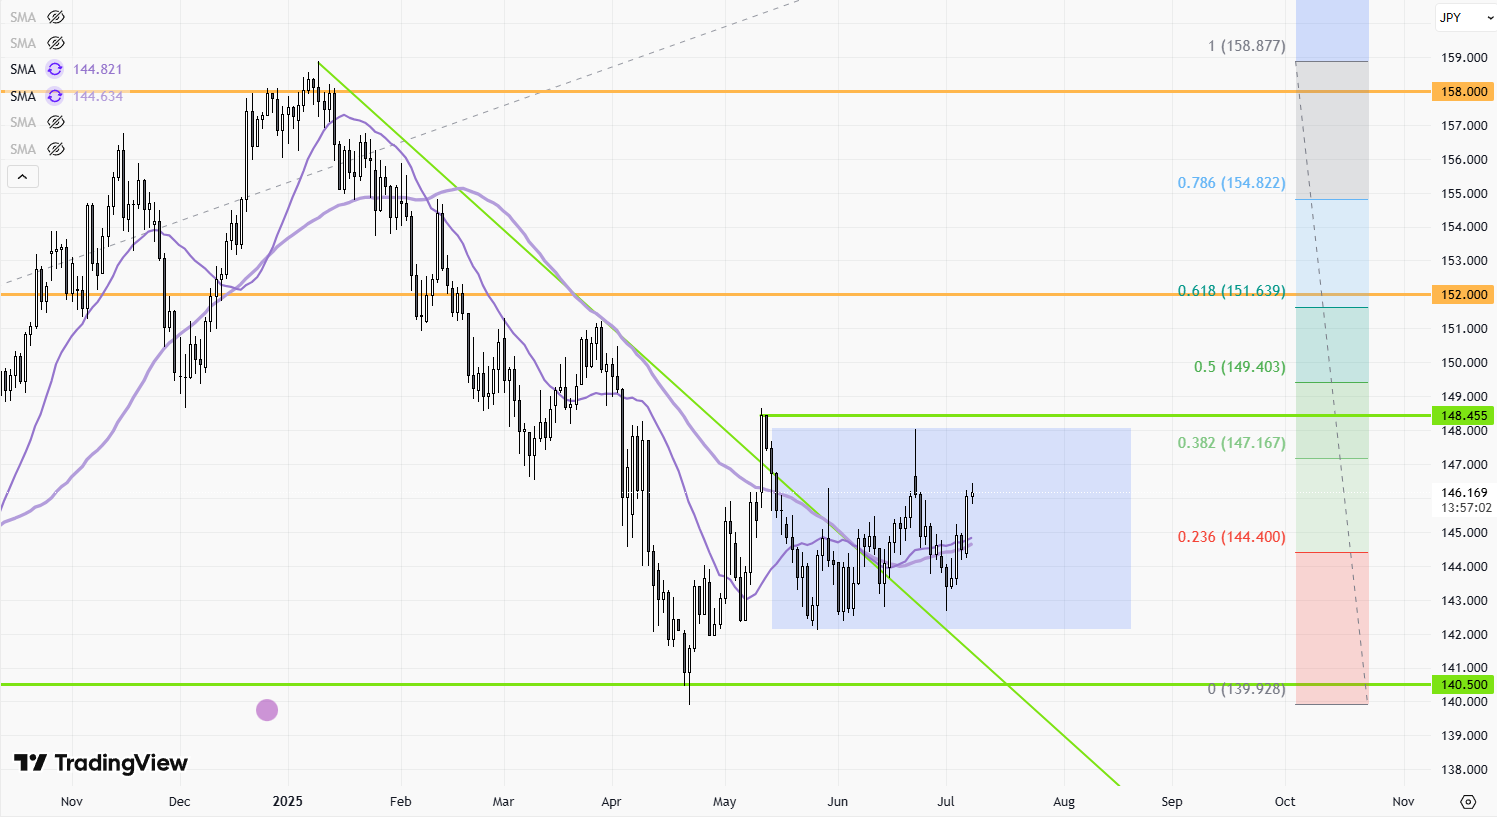
USDJPY-Daily
2025-07-08 @ 15:17
<img class=”aligncenter wp-image-33036 size-large” src=”https://int.1uptick.com/wp-content/uploads/2025/07/FX-USDJPY-Daily-2025-07-08T141633.6270700.png”
Market Overview
USDJPY traded in a volatile range between 142 and 148 over the past week, driven by several key factors. Strong U.S. employment data buoyed the dollar, easing fears of a slowdown and pushing USDJPY to test resistance levels near 145 and 146. On the Japanese side, economic data remained weak, with falling employment and concerns about slow growth adding pressure on the yen. Additionally, newly announced U.S. tariffs on Japanese goods increased risk-off sentiment, prompting flows into the dollar as a safe haven. Rising U.S. bond yields and the wide interest rate differential between the U.S. and Japan further supported the dollar. While the market saw brisk moves, USDJPY remains rangebound for now, with traders watching for a breakout above 148 or a move below 142 to signal the next trend.
USDJPY Daily Candlestick Chart Analysis (as of July 8, 2025)
Technical Indicators and Signals
– Support and Resistance: The chart environment situates immediate support at 143.90–144.20, with a significant resistance level near 144.50–144.80, followed by another resistance around the 146.28 zone, which marks the top of the current trading range.
– Moving Averages & Bollinger Bands: While the chart specifics are not directly cited, resistance at the Bollinger Bands’ middle line around 144.80 is noted, often implying price compression and an approaching volatility expansion. Near-term moving averages are likely flattening, consistent with recent sideways price action.
– Momentum Oscillators: The MACD, RSI, and Stochastic Oscillator have recently registered bearish signals, pointing to a loss of upward momentum and a risk of further downside if support breaks. RSI is likely hovering near neutral, not showing extreme overbought or oversold conditions.
Chart Patterns
– Consolidation Pattern: The USDJPY has been trading within a broad consolidation zone centered around 145.00. The price action reflects hesitancy and choppy movement, lacking a clear breakout in either direction.
– No Major Reversal Patterns (Head and Shoulders, Double Top/Bottom): Recent price structure does not indicate a classic head-and-shoulders or double top/bottom pattern. There may be minor triangle or wedge formations, but the dominance remains with the horizontal range.
– Trendlines: A minor intraday upward trendline is visible, but the failure to sustain new highs and repeated tests of support indicate weakening bullish conviction.
Candlestick Patterns
– Doji and Spinning Tops: Frequent appearance of doji or small-bodied candles in the recent sessions reflects market indecision, a common precursor to breakout or directional shift.
– Absence of Strong Bullish/Bearish Engulfing: Recent candles have not demonstrated classic reversal signals such as engulfing patterns or hammers, reinforcing the neutral/sideways bias.
Trend Direction
– Sideways Consolidation: The broader technical picture is one of range-bound consolidation, with no clear trending direction. The brief rally attempts have met resistance near 146.28, while dips have found buyers near 143.90–144.20. This behavior underscores a lack of dominant momentum from either bulls or bears.
– Slight Bearish Undertone: While the market consolidates, technical indicators and fundamental commentary suggest a slight downside risk, with a potential for a drop towards the 142.44–141.70 area if support levels are breached.
Support and Resistance Levels
– Support: 143.90–144.20 (immediate), 142.44 (medium-term), with more distant support near 141.70.
– Resistance: 144.50–144.80 (descending trendline and Bollinger midline), 146.28 (recent swing high and range top).
Other Technical Insights
– Volume (if visible): Typically, declining volume during consolidation phases confirms the lack of breakout momentum, and a volume spike on a break would confirm directionality.
– Momentum Shifts: Persistent inability to break above resistance levels, combined with bearish technical signals, hints at building pressure to the downside.
Actionable Summary
USDJPY is locked in a sideways consolidation, bounded by support at 143.90–144.20 and resistance at 144.50–144.80. Price is struggling to break the upper range (146.28), while repeated tests of support signal growing vulnerability. Technical indicators are tilting slightly bearish, suggesting a potential downside move if support is breached—targets may extend towards 142.44 and ultimately 141.70. However, robust resistance and intervention warnings above 145.00 remain barriers to bullish momentum. Traders should await a confirmed breakout for higher conviction trades and closely monitor for a surge in volume accompanying any move out of this range. Tight risk management is warranted in this high-volatility, event-driven environment.