 |
| Gold V.1.3.1 signal Telegram Channel (English) |
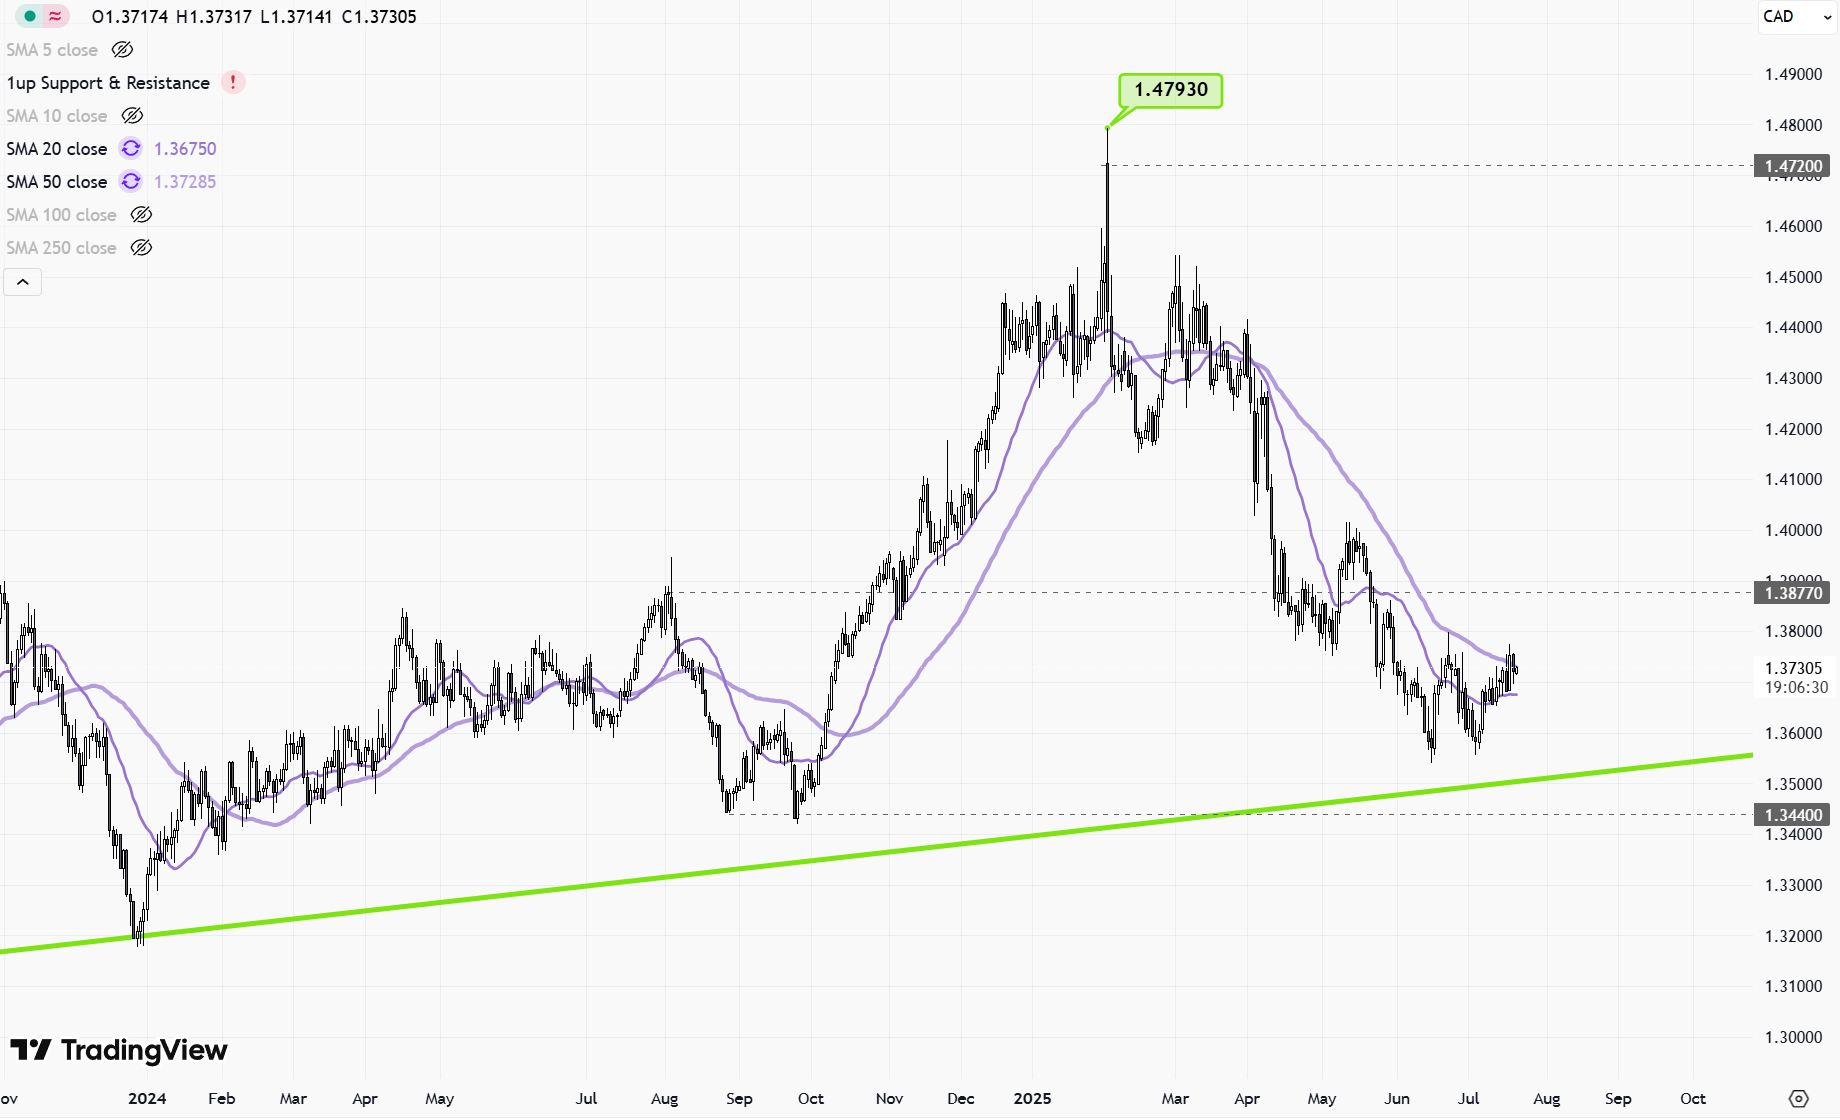
USDCAD-Daily
2025-07-21 @ 09:57
Market Overview
The USDCAD traded in a tight range over the past week, fluctuating between 1.3650 and 1.3730. Price action was shaped by competing factors: a surge in trade tensions following the announcement of new US tariffs on Canadian goods heightened uncertainty and put downward pressure on the Canadian dollar. However, robust Canadian employment data, with stronger job creation and falling unemployment, provided support for the loonie by tempering expectations of a near-term rate cut from the Bank of Canada. As a result, the pair remained largely stable, lacking strong directional momentum, as markets balanced trade policy risks against encouraging domestic economic fundamentals in Canada.
USDCAD Daily Candlestick Chart Analysis (July 21, 2025)
Technical Indicators & Their Signals:
– The price action has been gravitating around the 1.3685 level, which serves as a key pivot according to recent technical analysis. A move towards the upper boundary around 1.3800–1.3812 was forecasted, indicating that upward momentum remains significant.
– Implied use of indicators such as the Envelope (or similar bands) suggests that price has been consolidating along its central line and is now targeting the upper end of that range.
– While oscillators like RSI or MACD are not explicitly visible, recent market behavior implies a recovery in bullish momentum, with momentum likely increasing as price approaches resistance.
Prominent Chart Patterns:
– No clear classic chart patterns (like head and shoulders or triangles) are detailed in the most recent commentary.
– The ongoing consolidation phase near 1.3685 with higher price tests hints at a potential ascending channel or range breakout scenario towards 1.3800 plus.
Candlestick Patterns & Implications:
– The daily structure up to July 21 shows a shift from mildly bearish candles (red closes near 1.3685) to a recent push higher (rise to 1.3720), supporting the idea of bullish engulfing or momentum candles. This suggests renewed buying interest and a potential bullish continuation.
– If the latest candle has a significant body and closes near its high, this would further reinforce bullish sentiment.
Trend Direction Assessment:
– The pair has transitioned from a sideways consolidation phase into a developing uptrend, with recent closes above intermediate resistance confirming positive sentiment.
– The move towards 1.3720 after basing at 1.3685 confirms a short-term uptrend, though the broader trend remains dependent on a firm break above 1.3800.
Major Support and Resistance Levels:
– Support:
– 1.3685 (major structural pivot, previously magnet for consolidation)
– 1.3650 (recent swing low and psychological round number)
– Resistance:
– 1.3720 (short-term, tested in recent sessions)
– 1.3800–1.3812 (multi-session high and Envelope upper boundary, critical breakout level)
Additional Technical Insights:
– The momentum shift from consolidation to bullish expansion is evident as price lifts from 1.3685 to 1.3720 and tests the upper band of recent ranges.
– No volume information is directly available, but the shift in candle structure and proximity to resistance suggests increasing participation as traders anticipate a breakout.
– If price fails near 1.3800, expect a possible pullback to retest support at 1.3685, which would then be a crucial level for judging the sustainability of the new uptrend.
Actionable Summary:
USDCAD is staging a bullish breakout from a range defined by 1.3685 support and 1.3800 resistance. Technical momentum is favoring the upside, with buyers pressing the action towards a possible 1.3812 extension. Traders should monitor for a decisive daily close above 1.3800 to confirm trend continuation. A failure here may prompt a short-term retracement, but support at 1.3685 remains robust and pivotal for the near-term outlook. Continue to watch price behavior around these levels for fresh signals on next directional moves.