


 |
| Gold V.1.3.1 signal Telegram Channel (English) |
EURUSD-Daily
2025-07-21 @ 10:05
Market Overview
Over the past week, EURUSD experienced a moderate decline, slipping from around 1.1779 on July 4 to 1.1689 by July 11. This drop was primarily driven by a stronger US dollar after the Euro broke its May channel support, which then acted as resistance during mid-week volatility. The US Dollar Index (DXY) maintained strength above key support at 97.70, reinforcing USD demand. Market sentiment suggests a tight trading range for EURUSD between 1.1565 and 1.1720 in the near term as traders await clearer economic data and policy signals. Overall, dollar strength and Euro technical breakdowns have weighed on the pair.
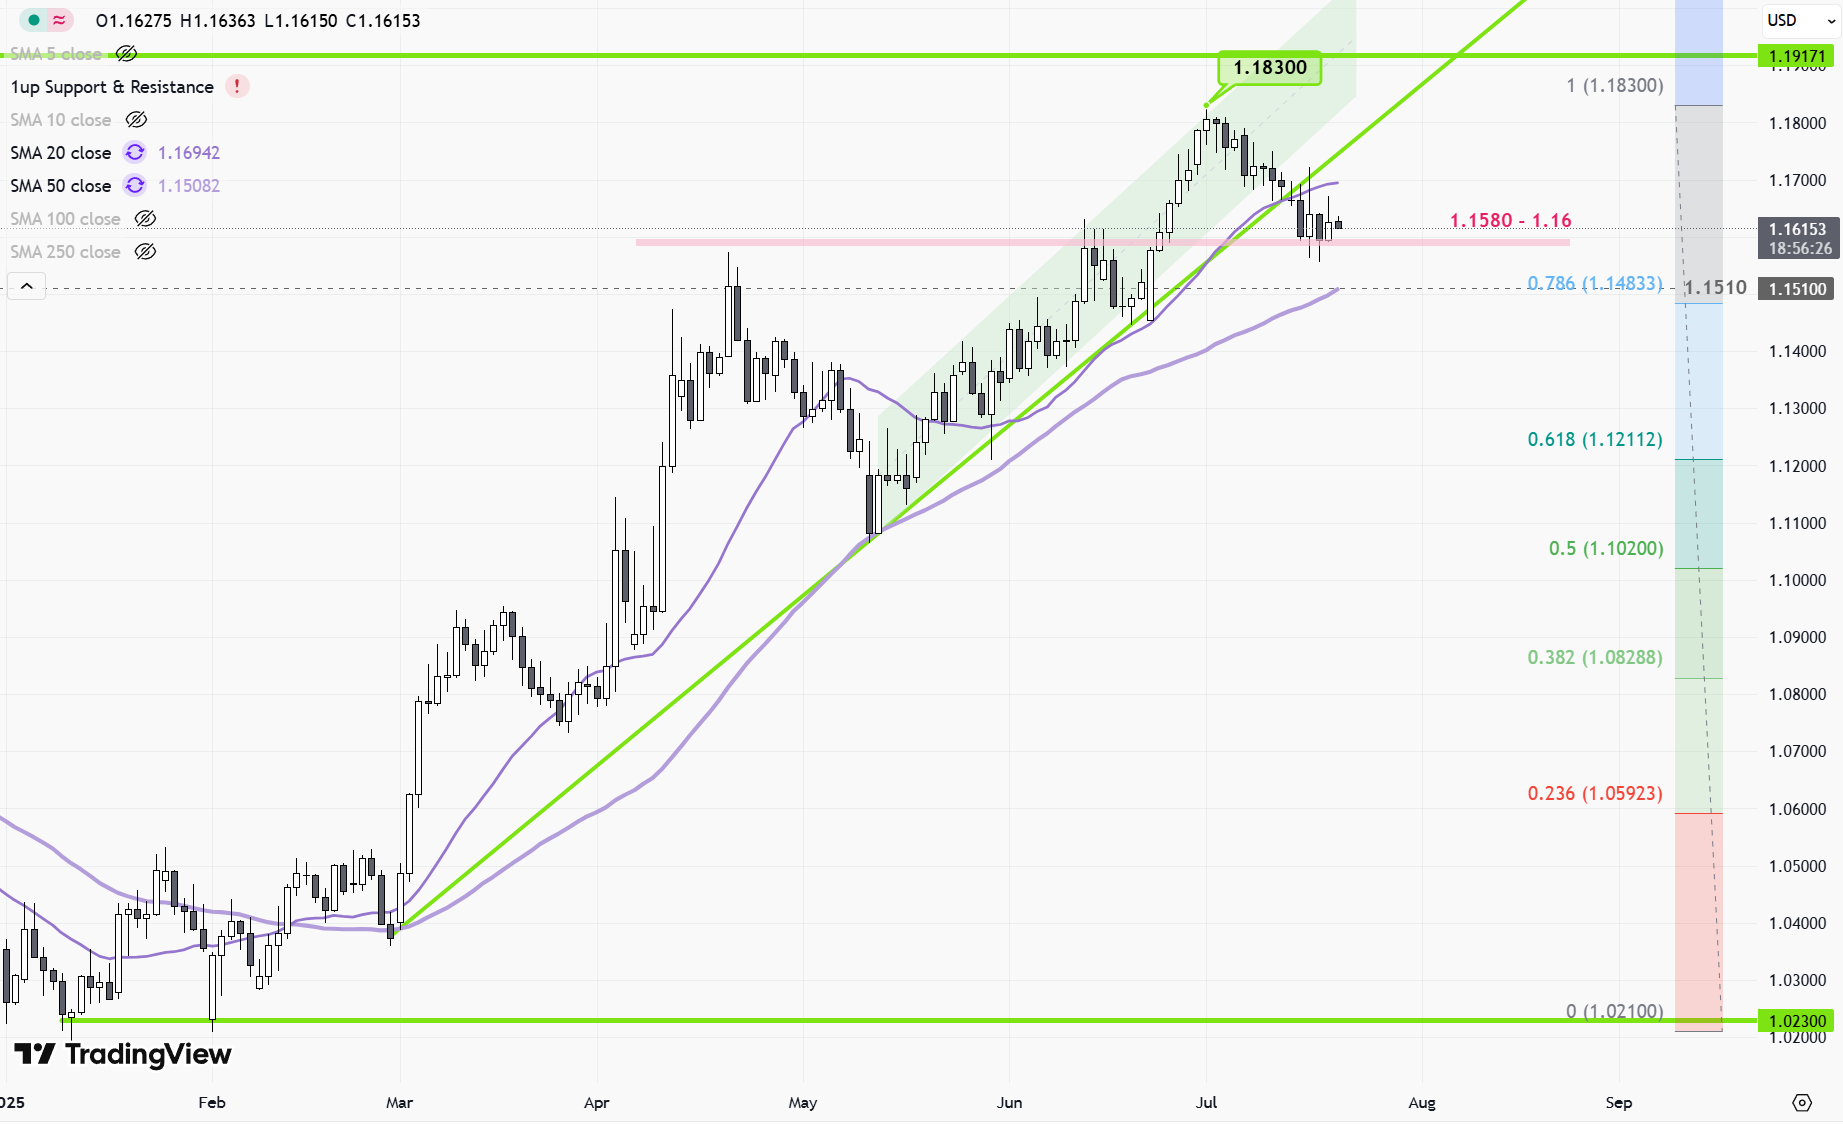
EURUSD Daily Candlestick Chart Technical Analysis – July 21, 2025
Technical Indicators:
– The 50-day moving average is currently a pivotal reference point. Price action is challenging or just under this level, signaling that momentum is at an inflection zone. A confirmed close below could signal expanding downside potential, while holding above or reclaiming it may support a reversal.
– The RSI is showing oversold conditions or is at least close to the oversold threshold, reflecting the near-term bearish momentum. This raises the likelihood of a technical rebound or a pause in the selling, especially with prices extended away from mean levels.
– Momentum indicators (such as MACD) are reflecting persistent selling pressure, but momentum “just fell below the mid-line,” hinting at growing seller strength. Short-term exhaustion is possible, but the bears remain in control pending a clear reversal signal.
– Bollinger Bands recently showed price action puncturing or riding along the lower band. This is a classic sign of increased volatility and trend persistence. However, prolonged separation from the middle band often precedes short-lived mean reversion moves or consolidation phases.
Chart Patterns and Structures:
– No fully-formed reversal patterns (such as a head and shoulders, double bottom, or broadening wedges) are currently dominating the chart.
– Price action reveals a sharp, persistent daily downtrend, echoing a bearish channel from the July peak. The absence of bullish reversal clusters suggests that the correction has either further to run or will at least consolidate before choosing direction.
– There are hints of a possible base formation or local consolidation between the 1.1520–1.1600 zone, but this is not yet confirmed as a lasting reversal pattern.
Candlestick Patterns:
– The recent daily candles after the strong sell-off may resemble small-bodied candles (such as doji or spinning tops), indicative of uncertainty or slowing downside momentum. If a hammer appears on higher volume around support, this could add weight to rebound risks, but the overall configuration still favors the bears until proven otherwise.
– Persistent red candles dominate since early July, with very limited bullish responses, reinforcing the control of bears for now.
Trend Direction:
– EURUSD is firmly in a downtrend since early July after an extended bullish run in the prior weeks. The move lower is sharp, and the current structure shows no successful bullish reversal, though short-term exhaustion is evident.
– The current price action is near key support zones and could soon shift into sideways consolidation if bears cannot force a clear breakdown.
Major Support and Resistance Levels:
– Support:
– 1.1520–1.1560: Immediate downside target and local support, coinciding with a confluence of technical indicators and historical pivots.
– 1.15: Psychological support and a previous reaction low.
– 1.12–1.13: Larger base zone for the cycle; failure at current levels could target this deeper range.
– Resistance:
– 1.1600–1.1630: First major barrier on any rebound; marks old support and short-term sellers’ break zone.
– 1.1675: Key pivot and the “center” of the current Elliott wave structure; a move above here would signal trend exhaustion and further upside possibility.
– 1.18: 2025 high and long-term structural resistance.
Other Relevant Insights:
– Momentum is deeply negative, but the market is approaching oversold levels, increasing the chance for a temporary bounce or consolidation before another leg lower or reversal.
– Volume analysis (although not visible in a static chart) often reveals capitulation or exhaustion phases at these technical extremes; watch for a spike, as it may precede a short-lived reversal.
– Macro factors and a busy U.S. economic calendar compound technical uncertainty and may drive volatility at key levels.
Actionable Outlook:
EURUSD remains locked in a strong downtrend, with bears in command as prices test key support levels at 1.1520–1.1560. Technical exhaustion and oversold conditions could trigger a short-term rebound, especially if buyers defend 1.15. However, as long as the pair remains below 1.1675, further downside cannot be ruled out. Monitor closely for reversal candlestick patterns at support, and be alert for any signs of momentum divergence or sharp volume changes for early signals of a trend change. For now, rallies are likely to face resistance near 1.1630 and 1.1675, and breaks below 1.15 could open much broader declines.