


 |
| Gold V.1.3.1 signal Telegram Channel (English) |
EURUSD-1 hour
2025-07-21 @ 22:25
Market Overview
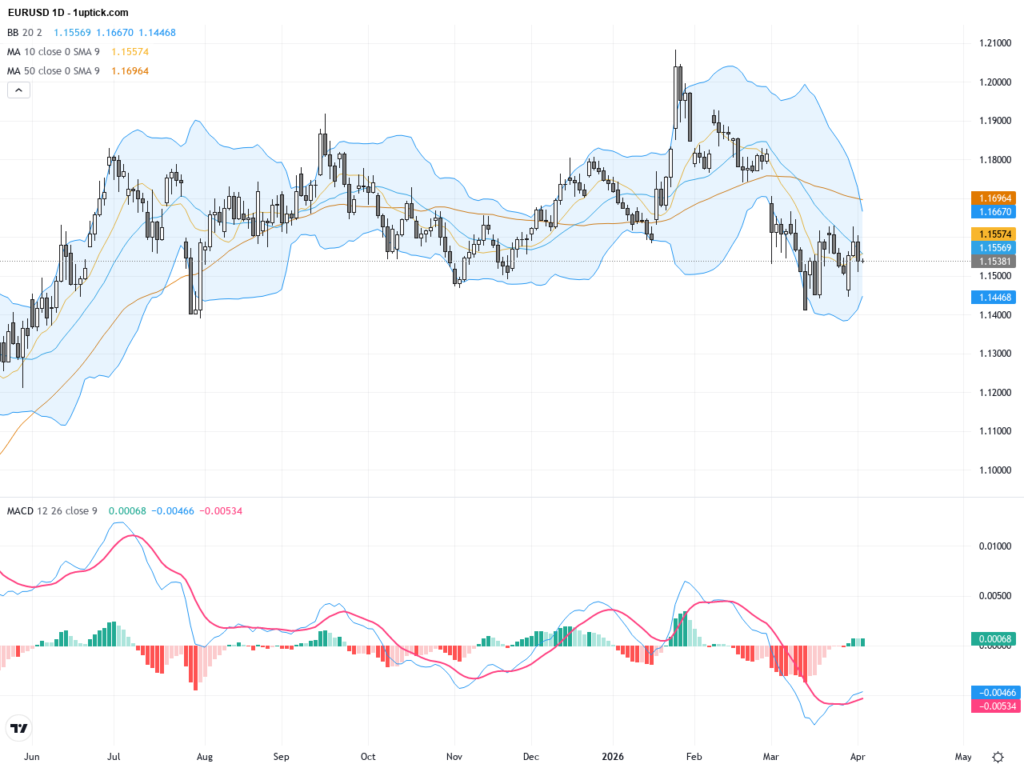
EURUSD has experienced a moderate pullback over the past week, dropping from near 1.1826 to around 1.1690. This decline comes after the euro broke its previous technical support, coinciding with a stronger US dollar as the Dollar Index held above key support at 97.70. Market sentiment has been shaped by anticipation of US inflation data, ongoing corrections after the pair’s year-to-date high, and political developments in the US that have placed pressure on the dollar. Despite the correction, the underlying uptrend remains, but technical momentum indicators signal caution, with the RSI nearing neutral. Traders are watching the key support zone at 1.1575 and resistance levels between 1.1685 and 1.1750, expecting the pair to remain range-bound until a clear breakout occurs.
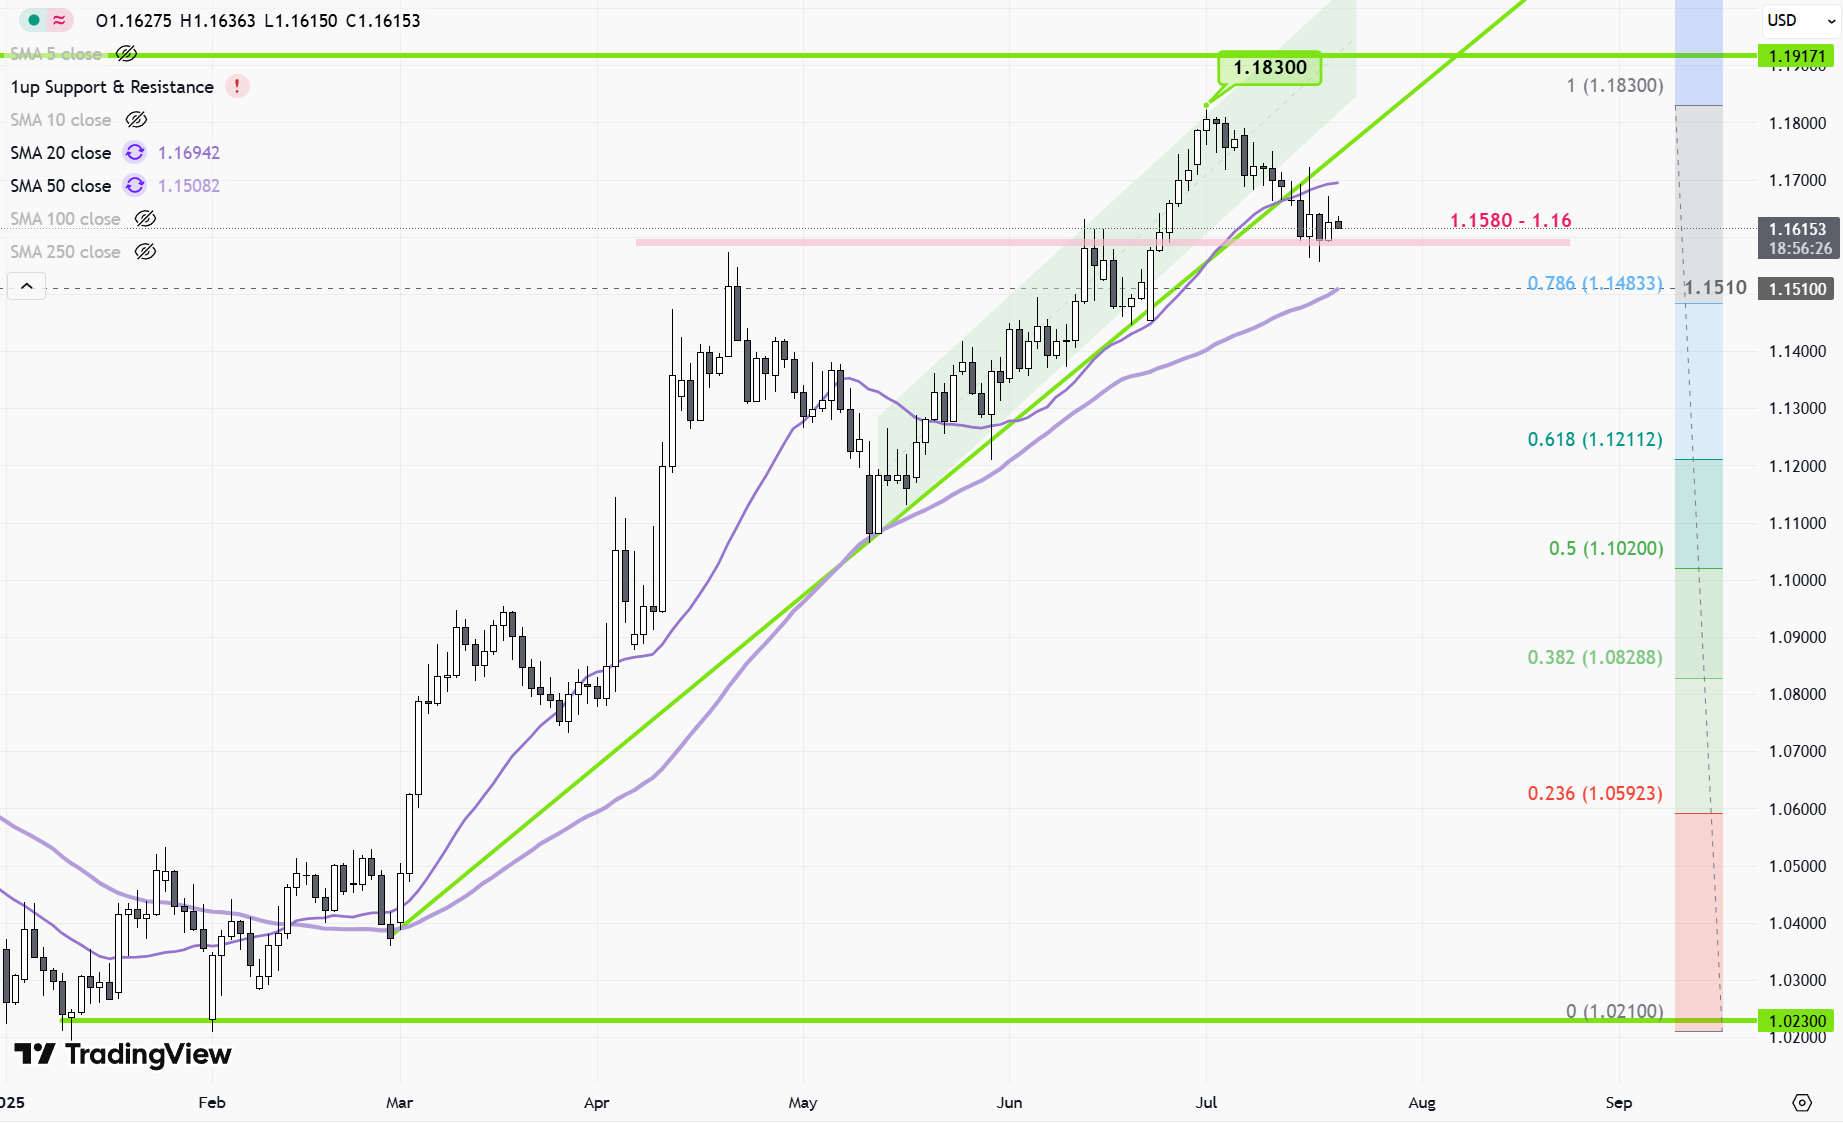
EUR/USD 1-Hour Chart Technical Analysis – July 21, 2025
Technical Indicators (Visible and Implied):
– Trend: The broader setup reveals a counter-bearish channel, suggesting a prevailing downward bias in recent sessions, though there have been attempts to sustain intraday rebounds.
– Support and Resistance:
– Major Support: 1.1580, 1.1520, 1.1500, 1.1440.
– Major Resistance: 1.1670, 1.1730, 1.1800.
– Moving Averages: While not explicitly detailed in the attached chart, price action and structure suggest that EUR/USD is currently trading below key short- and medium-term averages, confirming ongoing bearish momentum.
– Momentum Oscillators: Technical signals point to further losses unless the bulls reclaim the 1.1750 handle, indicating momentum remains weak for bulls in the short term.
– MACD/RSI: If these are on your chart, MACD histogram likely remains below the zero line and RSI probably oscillates in lower-to-mid ranges — both indicating bearish momentum but approaching oversold levels which could allow for corrective bounces.
Chart Patterns:
– No textbook reversal formations such as head-and-shoulders or double bottom structures are clearly evident at this stage.
– The price appears to be respecting a declining parallel channel, indicating a dynamic resistance zone above and offering potential short entries on rallies into resistance.
– Failed attempts to break firmly above 1.1670-1.1730 reinforce the strength of that resistance region.
Candlestick Patterns:
– The most recent clusters near support zones (particularly at 1.1556–1.1580) likely exhibit short-bodied candles with extended lower wicks (hammer-type), showing bids emerging from local lows, but follow-through remains limited as sellers reassert themselves above 1.1625.
– No convincing bullish engulfing or major reversal candlestick patterns are yet confirmed at time of review; price action suggests hesitation and lack of strong conviction from buyers.
Trend Assessment:
– The short-term trend remains down, pressured by aggressive selling on rallies and an inability to close above key resistance levels.
– Despite a temporary rebound on Friday (linked to Fed rate-cut commentary), EUR/USD continues to post lower highs and lower lows, confirming the downtrend structure in effect.
Support and Resistance Levels:
– Immediate Support: 1.1580, with a deeper extension risk to 1.1520 and 1.1500.
– Immediate Resistance: 1.1670 (key pivot), above which 1.1730 and 1.1800 become upside targets. Only a sustained recovery and close above these would threaten the current bearish outlook.
Other Notable Technical Insights:
– Volume/Momentum: If available, volumes have thinned on rebounds, hinting at lack of committed buying interest and providing little evidence of capitulation by short-sellers.
– Wave Analysis: Recent price structure suggests that a corrective wave lower may be close to exhaustion, but unless higher resistance zones are overtaken swiftly, risk of renewed downside remains dominant.
Actionable Outlook:
– EUR/USD remains vulnerable to further losses while capped below 1.1670–1.1730. Selling rallies into resistance remains favored until price action delivers a close above 1.1730.
– Potential for corrective rebounds exists if intraday hammers or bullish divergence on oscillators develop near 1.1520–1.1550, but these should be treated as counter-trend opportunities unless sustained buying volume emerges.
– Key tactical levels: Bulls must reclaim and hold above 1.1670–1.1730 to shift the technical landscape back toward stabilization or recovery; bears eye targets at 1.1520 and potentially 1.1440 if downward momentum persists.
Summary:
EUR/USD is still entrenched in a downtrend on the 1-hour chart, respecting descending resistance and producing only modest bullish attempts from support. Immediate focus is on whether 1.1520 holds against further selling pressure, while any sustainable reversal would require at least a close above 1.1670. Tactical bias remains bearish until proven otherwise, with any upticks viewed as opportunities to fade into strength unless momentum shifts decisively.