


 |
| Gold V.1.3.1 signal Telegram Channel (English) |
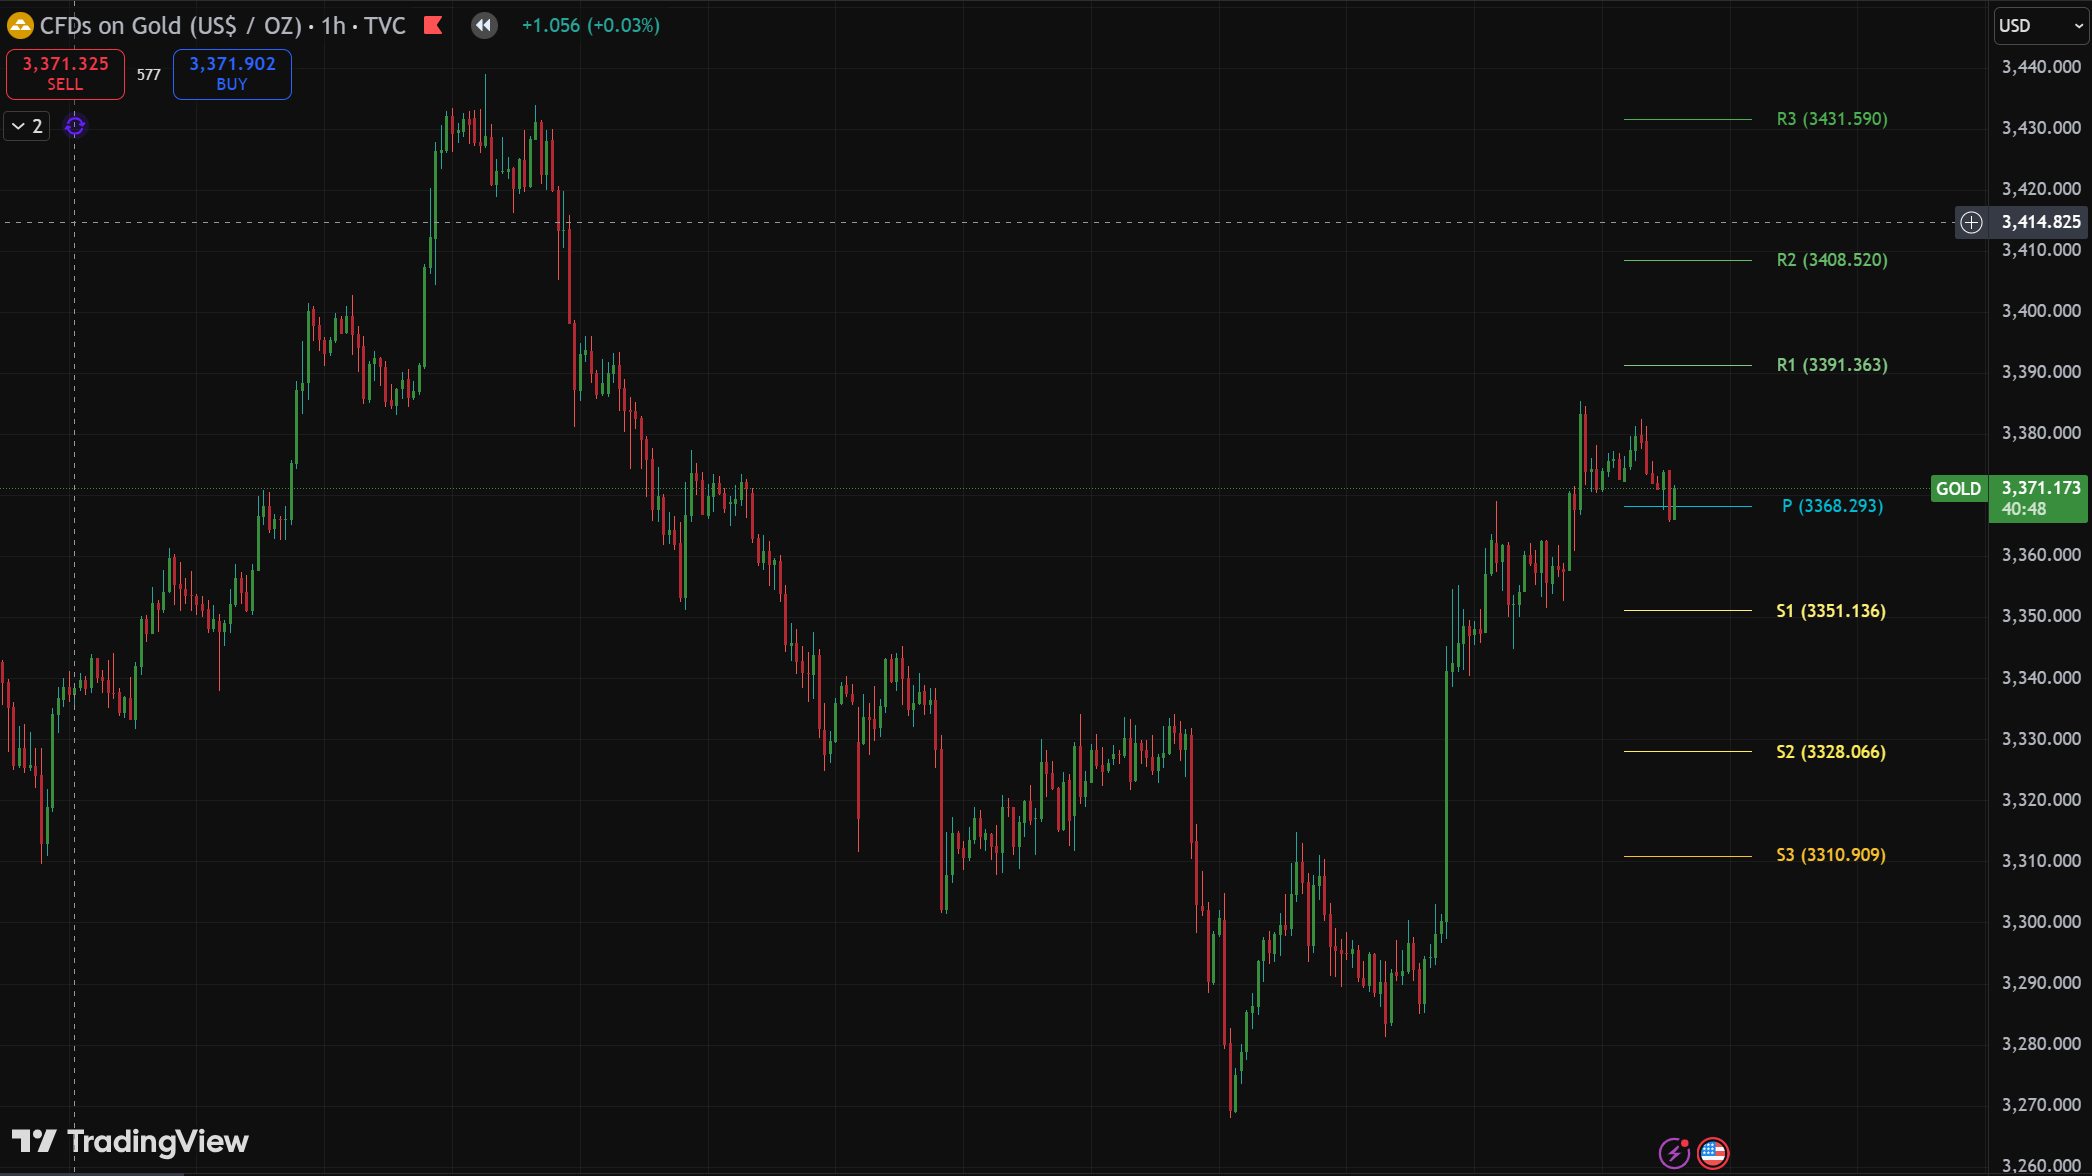
XAUUSD-1 hour
2025-08-05 @ 15:22
Market Overview
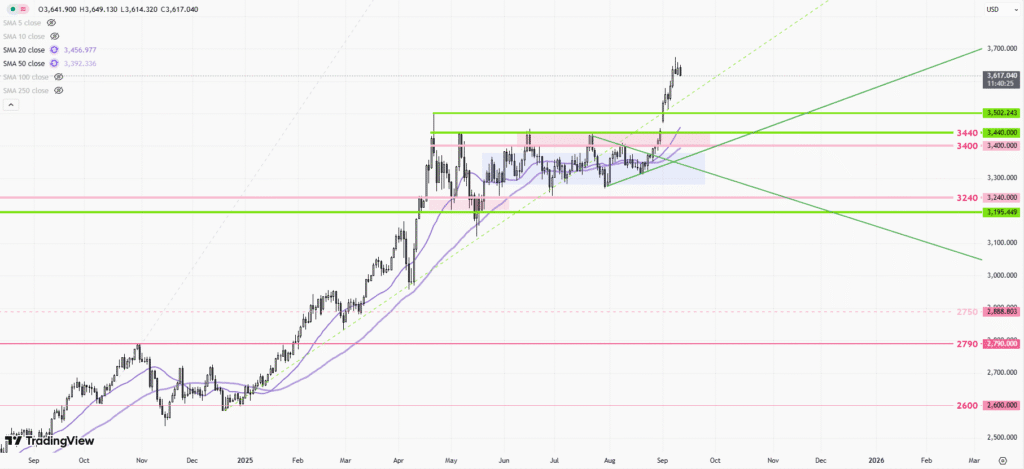
Gold (XAUUSD) experienced volatile movement over the past week, initially surging sharply due to rising global risk sentiment before undergoing a correction. Prices climbed as high as $3,435/oz, boosted by concerns over new trade tariffs proposed by the U.S. and weaker-than-expected US labor data, which heightened expectations of a Federal Reserve rate cut. However, momentum shifted after Friday’s rally, with gold pulling back to around $3,358/oz as traders took profits and technical resistance near $3,350/oz proved tough to breach. Market sentiment also turned mixed after July’s bearish monthly candle close, suggesting potential further downside. Overall, trade tensions, central bank policy expectations, and key technical levels are driving current price action, keeping the outlook for gold near $3,300/oz pivotal.
Gold (XAUUSD) 1-Hour Candlestick Chart Analysis
Technical Indicators:
On the 1-hour chart, gold is trending near the upper range of the Bollinger Bands, indicating heightened volatility and short-term overbought conditions. When the upper band is expanding, this often signals a period of increased momentum and potential breakout scenarios. While not explicitly visible, the price’s relationship to the upper band suggests strong bullish sentiment. No explicit signals for RSI or MACD are present in the image, but given the recent sharp upward moves, it is likely that short-term momentum indicators are also elevated, potentially entering overbought zones or showing bullish crossovers. Moving averages—if applied—would likely be stacked in bullish order, with shorter periods above longer periods.
Chart Patterns:
Recent price structure shows a series of higher highs and higher lows, confirming the uptrend. There are no clear reversal patterns such as head and shoulders or double tops visible in the latest price action. Rather, the minor consolidations within the trend resemble continuations—bullish flags or pennants—which imply potential for further upside upon breakout.
Candlestick Patterns:
Several strong bullish candlesticks appear, including large-bodied green candles following brief pullbacks—these are characteristic of bullish engulfing patterns, supporting further strength. Small-bodied candlesticks within narrow ranges appear during consolidation zones, possibly representing pause or indecision (e.g., doji), but the subsequent bullish engulfing bars indicate that buyers are retaining control. No significant bearish reversal candles (shooting stars, hammers at swing highs) are present.
Trend Assessment:
The market is clearly in an uptrend on the 1-hour timeframe. Price action shows persistent buying pressure, with only minor and short-lived pullbacks. This sustained movement above previous swing highs confirms the uptrend’s strength.
Support and Resistance Levels:
Key resistance is located at the recent local high near 3,373. A breakout above this level may open the way towards the July high around 3,439. Key support is found at 3,344, aligning with the top of the previous consolidation and local retracement lows; further below, structural support appears near 3,325–3,300. A decisive drop below 3,314 would confirm loss of bullish control and possibly shift the bias to neutral or bearish in the near term.
Other Insights:
Momentum is strong, and price has shown resilience on each dip toward support, attracting buyers and confirming positive order flow. Volume data is not visible, but price action suggests increasing participation and interest as volatility expands.
Actionable Summary:
XAUUSD is in a well-established 1-hour uptrend, trading near key resistance at 3,373 following a sequence of bullish engulfing candles and continuation patterns. Overbought signals are present on Bollinger Bands, so minor pullbacks or consolidation are possible, but as long as price remains above 3,344 (first support), the bullish trend is intact with potential targets at 3,373 and 3,439. Watch for any reversal signals near resistance or a break below 3,314 for signs of trend exhaustion. For active trading, buying dips within the uptrend remains favored until clear reversal patterns emerge.