


 |
| Gold V.1.3.1 signal Telegram Channel (English) |
XAUUSD-1 hour
2025-08-11 @ 14:17
Market Overview
XAUUSD Weekly Summary: Gold eased over the past week, slipping from the mid-$3,400s toward the $3,370–$3,400 zone as upside momentum faded and traders reassessed rate-cut timing. Price action pivoted around the 100-day moving average area, with rebounds capped near $3,320–$3,350 resistance while $3,270–$3,300 offered support.
Key drivers:
– US data and Fed path: Softer growth pockets but sticky services inflation kept September cut odds in flux, tempering bullion’s upside while preventing a deeper selloff.
– Dollar and yields: A modestly firmer dollar and stable-to-firm real yields weighed on gold, limiting breakouts.
– Risk sentiment: Geopolitical headline risk and equity wobble underpinned safe-haven demand on dips, but follow-through buying was muted.
– Positioning/technicals: Crowded long positioning and July’s shooting-star monthly candle encouraged profit-taking, with traders watching acceptance above $3,300–$3,350 for renewed upside or a clean break below $3,270 for a move toward $3,240–$3,200.
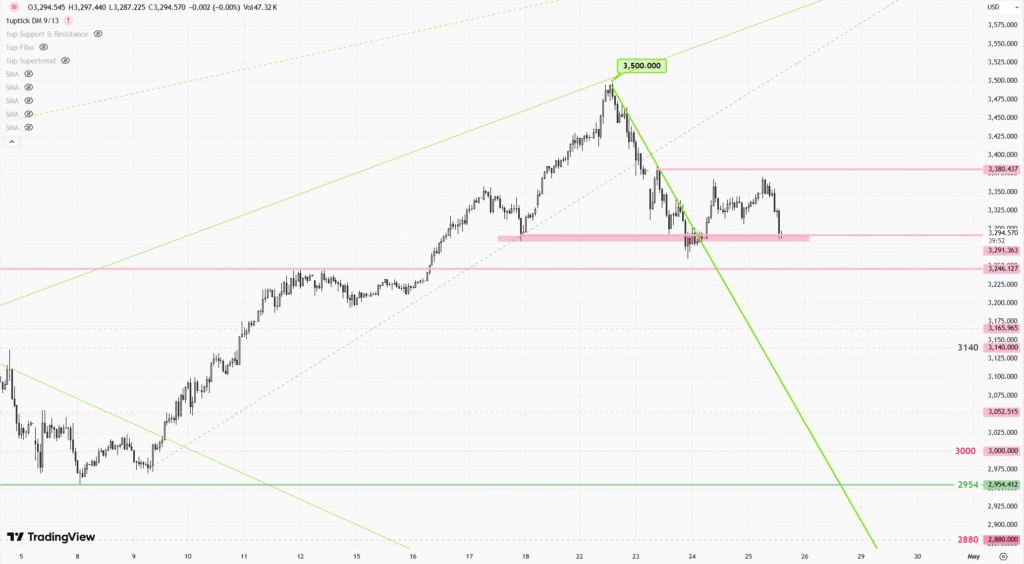
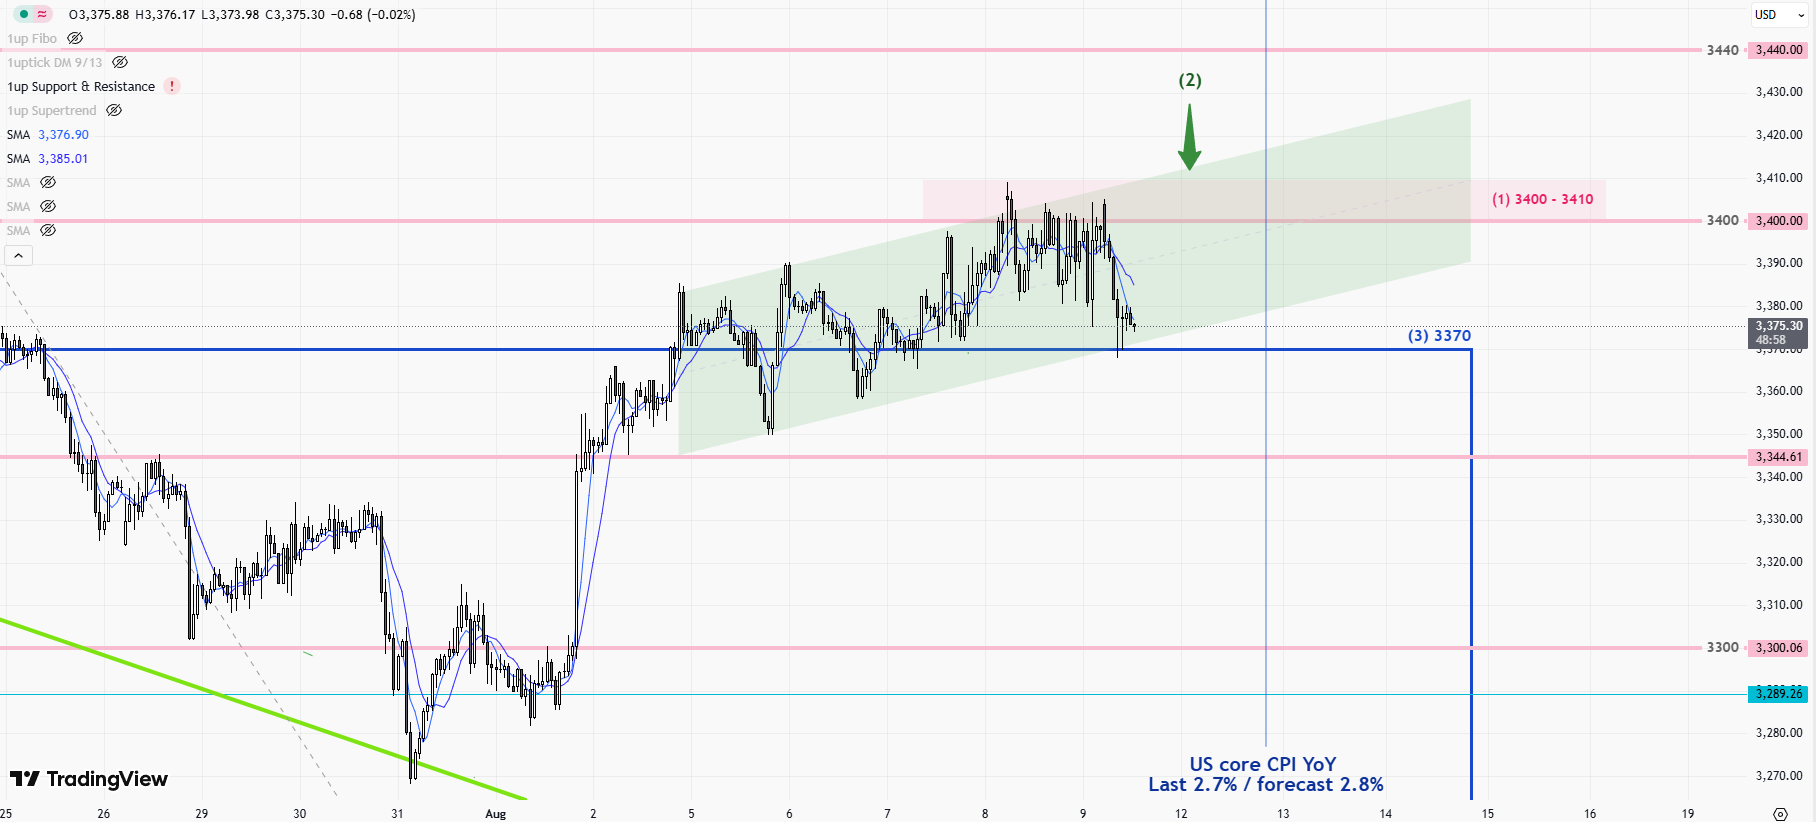
XAUUSD (Gold) – 1H Candlestick Chart Technical Analysis
Note: This analysis is based solely on the attached 1-hour chart image. Levels and signals refer to what is visible on that chart.
Technical indicators (visible/implied) and signals
– Moving Averages:
– Price is trading above the short-term moving average (appears to be the 20-period EMA/SMA), which is rising, signaling near-term bullish momentum.
– The medium-term moving average (likely 50-period) is trending upward beneath price, acting as dynamic support. The spacing between short- and medium-term MAs indicates positive but moderate momentum rather than a parabolic move.
– No clear 200-period MA is displayed; trend assessment relies on price structure and nearer MAs.
- Bollinger Bands:
- Bands are slightly expanding, and price has recently ridden the upper band on bullish pushes, indicating active upside pressure. Pullbacks are reverting toward the 20-period mid-band, holding above it—typical of a controlled uptrend.
- No persistent band walk; momentum is constructive but not overextended.
- RSI (implied from price behavior):
- Given repeated upper-band taps and shallow pullbacks, RSI would likely be holding above 50 with periodic pushes into 60–65. That supports a bullish bias without classic overbought extremes.
- MACD (implied):
- Momentum swings are making higher lows; histogram would likely be positive on rallies with shallow dips during consolidations—consistent with a trend-up, pause, trend-up sequence.
Prominent chart patterns
– Ascending Channel/Parallel Trend: Higher highs and higher lows define a rising channel. Price respects the lower trendline on dips and challenges the upper boundary on pushes.
– Potential Ascending Triangle on the right-hand side: A series of higher lows pressing into a relatively flat horizontal resistance zone suggests a buildup for a breakout.
– No validated reversal patterns (no confirmed head-and-shoulders or double top at the timeframe shown).
Candlestick patterns and implications
– Multiple bullish continuation candles near the upper band: small-bodied candles with upper progress and shallow wicks indicate orderly buying.
– Occasional small doji/spinning tops at resistance: show local indecision before minor pullbacks, but follow-through selling has been weak—favoring continuation higher.
– One or two bullish engulfing bars after pullbacks from mid-band support: support buyers stepping in, reinforcing the uptrend structure.
– No strong hammer/inverted hammer at key lows or dramatic bearish engulfing at highs to signal a reversal at this time.
Trend assessment
– The 1-hour chart is in an uptrend: higher highs and higher lows, price above rising short- and medium-term MAs, and pullbacks holding above the mid-Bollinger/short MA.
– Momentum is positive but not euphoric; dips are being bought, and consolidation is occurring near highs—typically bullish.
Key support and resistance levels
– Resistance:
– Immediate resistance: the recent swing high/ceiling that has capped price multiple times (horizontal line forming the top of the nascent ascending triangle).
– Secondary resistance: the channel top/upper Bollinger Band on impulsive pushes.
– Support:
– Near-term dynamic support: 20-period MA / Bollinger mid-band.
– Structural support: prior swing low within the channel (first higher low beneath current price).
– Major intraday support: base of the rising channel; a clean break below would weaken the uptrend and shift bias to neutral.
– If a failed breakout occurs, the most recent congestion base (the last multi-candle consolidation) is the first downside target.
Other relevant insights
– Momentum/Volume: While volume isn’t shown on the chart, the price behavior suggests momentum upticks on breaks and lighter retracements—constructive for continuation.
– Volatility: Bands are modestly widening; a confirmed break above horizontal resistance with expansion in range would validate a momentum continuation leg.
– Risk markers: A decisive 1H close back inside the body of the prior breakout candle, followed by loss of the mid-band and a lower low vs. the last pullback, would be the earliest warning that the uptrend is stalling.
Actionable summary
– Bias: Bullish on the 1H timeframe while price holds above the mid-band/short MA and maintains higher lows.
– If price closes above the identified horizontal resistance with increasing range, look for continuation toward the channel top/next resistance zone.
– Preferred setups:
– Buy-the-dip: Pullbacks to the mid-band/short MA that print bullish reversal candles, with stops below the most recent higher low.
– Breakout-continuation: 1H close above resistance followed by a shallow retest that holds; invalidation on a close back below the breakout level.
– Caution:
– A break below the rising channel support and a lower low vs. the last swing would shift the outlook to neutral and open room for a deeper pullback to the prior consolidation base.
Latest Technical Analysis