![[Daily Closing 🔔] Gold – Gold Price Outlook and Technical Analysis: Key Reasons Behind the Recent Decline and Support Levels](https://int.1uptick.com/wp-content/uploads/2025/05/2025-05-09T043547.401Z-file-1024x576.png)


 |
| Gold V.1.3.1 signal Telegram Channel (English) |
USDJPY-Daily
2025-08-12 @ 12:40
Market Overview
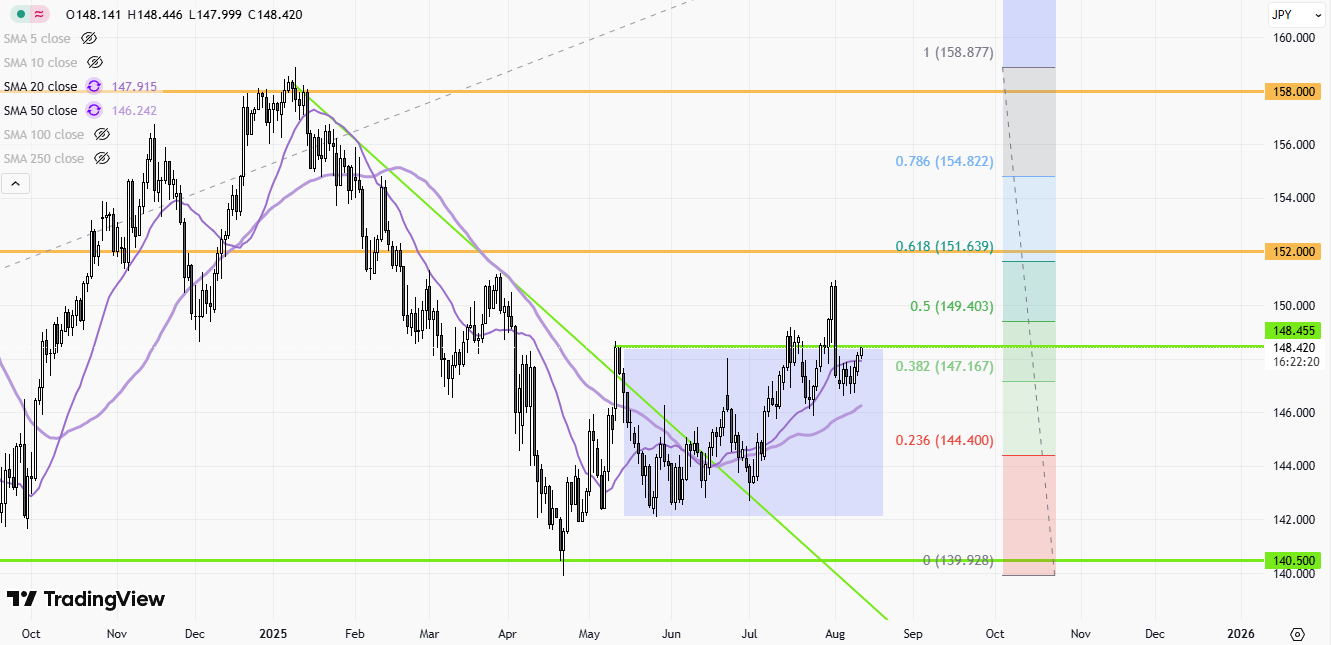
USD/JPY traded in a tight range near 147.5–148.5 over the past week after pulling back from a spike above 150 earlier in August. Price action has been consolidative, with resistance clustered around 147.8–148.2 and support near 146.6–147.0, as traders awaited key U.S. inflation data and fresh guidance on policy trajectories.
Drivers:
– U.S. data and Fed path: Softer recent U.S. employment readings increased expectations for a September Fed cut, capping broad USD upside and tempering sustained breaks above 148–149.
– Japan fundamentals: Weak real wage/income trends in Japan have undermined near-term BoJ tightening prospects, limiting durable yen strength.
– Policy signals: BoJ kept rates unchanged while nudging inflation forecasts higher, but emphasized external risks, reinforcing a gradualist stance.
– Technicals: A rectangular consolidation holds; a clean break below 146.6 could expose 145.9–144.5, while acceptance above 148.2–148.5 would refocus 149.5 and 150+.
USD/JPY daily shows a neutral-to-bullish consolidation just below recent swing highs, with price coiling in a tight range after a strong advance. Momentum has cooled without a decisive reversal signal, and the broader structure still favors the upside unless key supports break.
What’s visible on the attached chart
– Price action:
– The recent candles form a narrow-bodied consolidation after a prior impulsive leg up, consistent with a rectangle/flag-like pause rather than distribution.
– Multiple upper and lower wicks over the last several sessions indicate two-way probing but no follow‑through, typical of pre-breakout compression.
– No decisive bearish reversal bar (e.g., strong bearish engulfing) is confirmed within the last few sessions; pullbacks remain contained.
- Candlestick reads:
- Several small real bodies near the same closing zone suggest indecision (doji/spinning-top behavior) rather than trend termination.
- Occasional lower-tails on pullback days show dip-buying interest on tests of nearby supports.
- Structure:
- Higher lows from the prior swing base remain intact, maintaining a constructive daily swing structure.
- Resistance is clustered near recent highs where multiple candles stalled at similar levels.
Implied indicators and their likely signals
– Moving Averages (MA):
– 20-day SMA: Likely rising and sitting just beneath price, acting as first dynamic support. A daily close above a rising 20-DMA after a tight pause typically supports continuation.
– 50-day SMA: Rising and below the 20-DMA, confirming bullish medium-term trend and offering secondary support on deeper dips.
– 200-day SMA: Rising and well below current price, underscoring the intact long-term uptrend.
– Signal: Bullish MA stack (price > 20 > 50 > 200) with shallow pullbacks favors buying dips while that alignment holds.
- RSI (14):
- Likely in the 50–60 zone after cooling from prior overbought readings. That “bullish neutral” band implies positive momentum without excess froth.
- Signal: A push back through 60–65 on a breakout would confirm momentum re-acceleration; loss of 50 would warn of a deeper corrective phase.
- MACD:
- Histogram likely contracting with a shallow bearish/flat crossover during consolidation, typical of momentum digestion after a run.
- Signal: Re-curl higher and signal-line cross above zero on a range breakout would confirm trend resumption; expansion negative alongside a support break would favor a larger pullback.
- Bollinger Bands (20,2):
- Bands have likely narrowed (squeeze) as daily ranges compress.
- Signal: A close outside the band following contraction often kickstarts a directional move; with trend context bullish, upside resolution has a statistical edge, but wait for confirmation.
Prominent chart patterns
– Rectangle/Range consolidation: Several sessions of sideways action under resistance point to a continuation setup if price resolves higher.
– No clean head-and-shoulders or double top is confirmed on the daily. The right shoulder/top confirmations would require a break of a defined neckline with expanding downside momentum, which is not present.
– A short-term ascending sequence of reaction lows within the range hints at a modestly bullish tilt.
Candlestick patterns and implications
– Repeated spinning tops/doji within the range reflect indecision; by themselves they are not reversal signals. Their context after an up-leg favors continuation if a bullish range break occurs.
– Occasional small bullish engulfing or long lower shadow bars on down days indicate demand on dips; confirmation requires follow‑through close above the pattern highs.
Trend assessment
– Primary trend: Uptrend (higher highs/lows and price likely above rising 50/200-day MAs).
– Near-term trend: Sideways consolidation with a bullish bias. A sustained daily close above range resistance would confirm uptrend resumption; a break of the lower bound would open a deeper correction.
Key support and resistance levels
– Immediate resistance:
– Range cap at the recent swing highs where multiple daily candles stalled.
– Above that, measured move targets from the rectangle equal the height of the range added to the breakout level.
– Immediate support:
– Range floor defined by the recent reaction lows within the consolidation.
– First dynamic support: rising 20-day SMA beneath price.
– Secondary support: rising 50-day SMA; a decisive close below it would be the first meaningful trend warning.
– Deeper support:
– Prior breakout/pivot zone from the last impulse leg.
– Trendline support drawn from the prior higher lows (if plotted) aligns near the 50-DMA region.
Additional insights
– Momentum regime: Bullish-but-resting. The pause has bled off overbought conditions without price damage—constructive for trend continuation if resistance breaks with expanding range and volume.
– Volatility: Band contraction suggests an impending range expansion; be prepared for a directional move. Breakout quality improves with a wide-range close and rising participation.
– Risk management: False breaks are common in rectangles—wait for a daily close beyond the range and ideally a subsequent hold/throwback that flips broken resistance into support. Conversely, a clean close below the range with a weakening RSI (sub-50) and widening MACD negative histogram would argue for a deeper retracement toward the 50-DMA and prior pivot supports.
Actionable technical outlook
– Bullish continuation setup: Favor longs on a daily close above the established range high, seeking measured-move objectives equal to the range height, with invalidation on a close back inside the range or below the breakout pivot.
– Buy-the-dip setup: If price retests the lower bound or the rising 20–50 day SMAs and prints a bullish reversal candle, consider entries with stops below the range low/50-DMA.
– Bearish contingency: Stand aside or tactically short only on a decisive daily close below the range low and 50-DMA, confirmed by RSI < 50 and MACD expansion negative; target prior pivot supports.
Latest Technical Analysis