


 |
| Gold V.1.3.1 signal Telegram Channel (English) |
EURUSD-Daily
2025-08-13 @ 11:57
Market Overview
EURUSD traded in a consolidative range over the past week, oscillating between 1.1550 and 1.1700, with recent attempts to breach the 1.17 handle. The pair rebounded strongly from August lows near 1.1390, buoyed by renewed US dollar weakness and dip buying after July’s sell-off. Key drivers included anticipation of US inflation data and expectations of a Federal Reserve rate cut, which pressured the dollar. Eurozone fundamentals were mixed, but traders focused on the narrowing rate differential as the ECB held rates steady while markets priced in further Fed easing. Despite a miss in Eurozone sentiment data, overall market sentiment favored modest euro strength, keeping the outlook neutral to slightly bullish as long as the pair stays above 1.1500. Upside remains capped near 1.1700 unless a clear catalyst emerges.
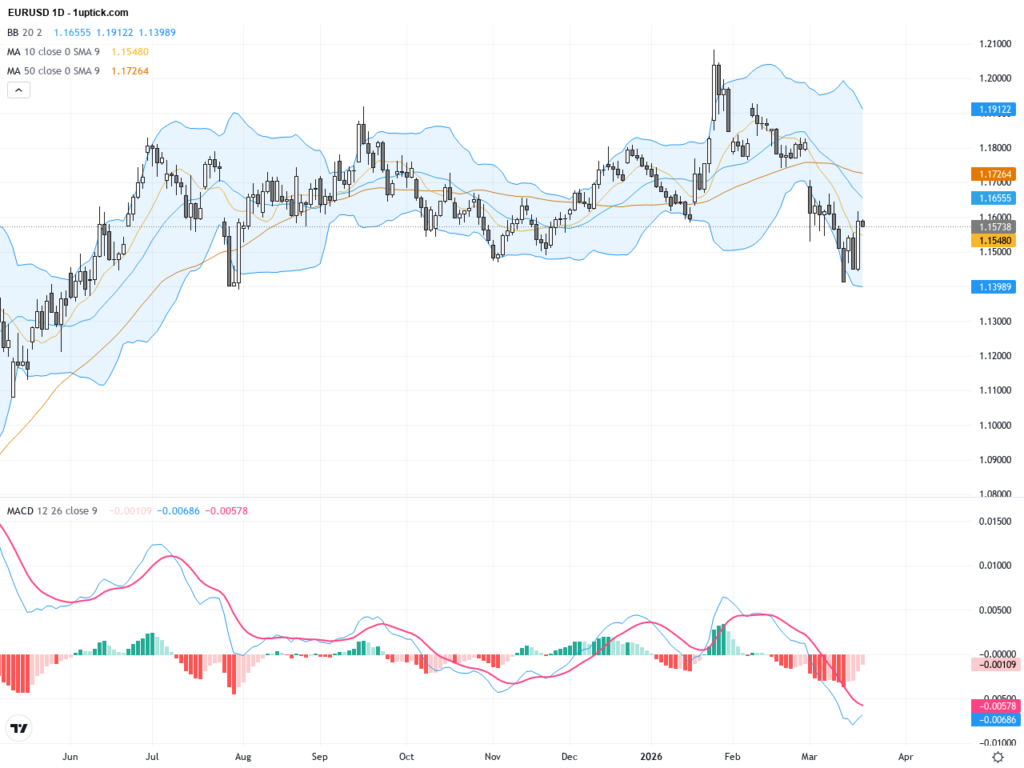
EURUSD Daily Chart Technical Analysis – August 13, 2025
Technical Patterns & Indicators Visible on the Chart:
- The daily candlestick chart shows EURUSD trading within a defined price range, following a period of directional movement.
- Recent candles display several relatively small-bodied sessions, indicating current indecision and diminished momentum, typically seen in ranges or near key support/resistance.
- Notably, earlier in the chart (early August), there was a sharp downward impulsive move, which appears to have paused, leading to consolidation.
- No explicit technical indicators (like moving averages, RSI, MACD, or Bollinger Bands) are displayed on the chart, nor is volume data present.
Analysis of Patterns, Implied Indicators, and Signals:
Implied Trend and Market Structure:
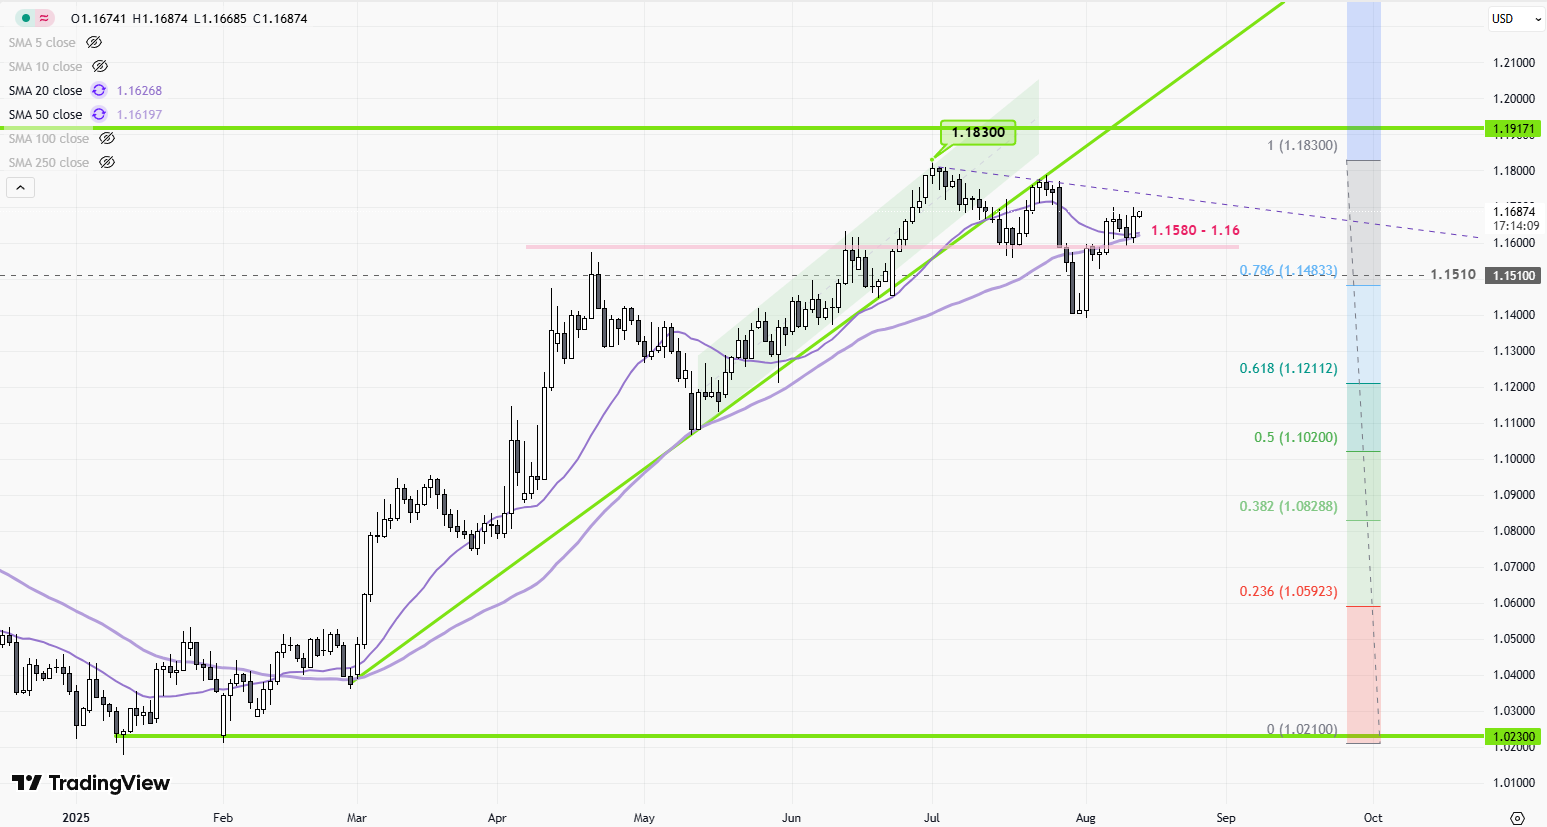
– The primary downtrend since late July/early August is apparent, with lower highs and recent lower lows.
– Current price action has established a new consolidation range just below the previous support-turned-resistance region (around 1.1650–1.1700), with local support near 1.1610 and major support at 1.1520–1.1445.
Key Support and Resistance Levels:
– Resistance: 1.1650–1.1700 (recent breakdown point and prior local highs).
– Support: 1.1610 (short-term), then 1.1520, and major structural support at 1.1445 (the low that previously reversed price action in June and August).
– Upside resistance: If the pair rallies, overhead resistance is near 1.1800 (the top of the previous impulsive moves).
Candlestick and Chart Patterns:
– No classic candlestick reversal patterns (like doji, engulfing, or hammer) are clearly evident in the most recent bars; instead, a series of small candles reflects sideways hesitation after a sharp leg down.
– Previous bullish price action (late July) included a Morning Star pattern that led to an upward impulse, but this has been negated by the recent breakdown.
– No dominant classical chart patterns (such as clear head and shoulders, double top/bottom, triangles) are forming in the most recent price structure.
Implied Technical Indicators:
– Considering the rapid move followed by range-bound trading, momentum indicators (RSI, MACD) would likely show:
– RSI is retreating from overbought/neutral, now mid-range or slightly oversold on the daily (supporting potential for consolidation or incremental downside).
– MACD likely turned negative with the recent breakdown, keeping bearish momentum intact, unless a bullish cross emerges.
– Moving averages (e.g., 20 and 50-day):
– The price appears to trade below the 20-day and 50-day averages, which likely slope downward—confirming bearish trend structure until reclaimed.
– Bollinger Bands would likely be widening during the impulsive move, then tightening as volatility contracts in the recent small-range candles.
Elliott Wave and Other Insights:
– Downward “impulse wave” appears to be mature, but the lack of strong reversal patterns suggests another downside leg is plausible unless the 1.1700 level is reclaimed.
– Recent analyst forecasts anticipate either a breakout lower through 1.1520 toward 1.1340 as a primary scenario, with interim corrective bounces likely capped below 1.1700.
Momentum and Volume (if available/implied):
– Current price action suggests deceleration in downside momentum, common when approaching key multi-month support.
– Absence of high volume (not shown on chart) would corroborate a lack of conviction in either direction, favoring range-bound action until a catalyst (fundamental or technical) emerges.
Technical Outlook and Trading Implications:
- Primary trend remains bearish as long as EURUSD trades below the 1.1700 area, with bears in control on rallies up to this resistance.
- Critical support lies at 1.1520 and especially 1.1445—any break below these levels markedly increases downside momentum towards 1.1340 or lower.
- Short-term, expect continued consolidation or range-bound trading between 1.1610 and 1.1700; a clear break of this range will determine the next directional leg.
- Absence of reversal candlestick patterns suggests patience is warranted for fresh entries—look for either a breakout with momentum confirmation or the emergence of a clear bullish engulfing/doji/hammer pattern for contrarian setups near major support.
Actionable Summary:
– EURUSD is in a bearish technical structure, with consolidation following a sharp impulsive decline.
– Watch for bearish continuation below 1.1610/1.1520 toward 1.1445 and 1.1340.
– A sustained break and close above 1.1700 would neutralize the immediate bearish bias and open the way for a corrective rally toward 1.1800.
– Tactically, favor short positions on rallies failing below 1.1700, or consider tactical longs only if there is strong reversal candlestick evidence near 1.1445.
– Key levels to watch: 1.1700 resistance, 1.1520/1.1445 support—breaks determine the next significant move.