


 |
| Gold V.1.3.1 signal Telegram Channel (English) |
BTCUSD-Daily
2025-08-13 @ 12:09
Market Overview
BTCUSD traded around 118,850 this week, posting a modest gain of about 1.2% over the past seven days. After reaching an all-time high above 114,000 in early August, price action has stabilized, reflecting cautious optimism in the market. Key drivers behind the recent movement include continued institutional inflows, highlighted by strong investment flows into Bitcoin ETFs, and favorable macroeconomic sentiment supporting risk assets. Additionally, anticipation of regulatory clarity and growing mainstream adoption have contributed to sustained demand. However, some short-term volatility has emerged due to profit-taking after historic highs and sensitivity to U.S. interest rate expectations. Overall, the market sentiment remains bullish, supported by robust fundamentals and increasing acceptance of Bitcoin within traditional financial systems.
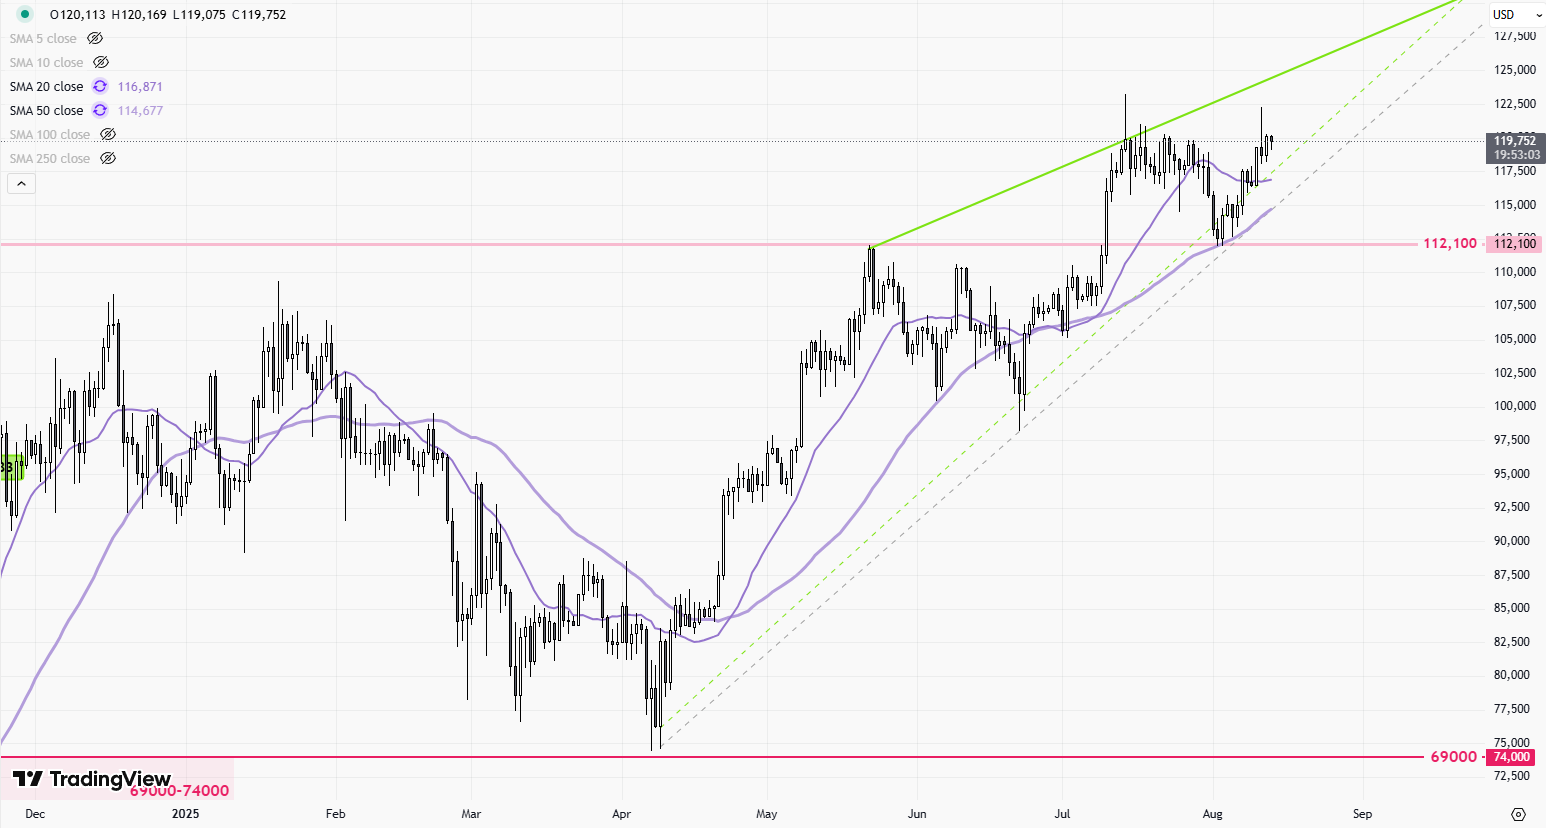
BTCUSD Daily Candlestick Chart: Technical Analysis
Visible Patterns and Indicators on the Chart
- Double Top Pattern: The chart displays a clear double-top near the all-time high (around 123,200). The neckline is approximately at 112,000, making this a significant bearish formation. A confirmed break below the neckline would imply a trend reversal and additional downside risk.
- Shooting Star Candlestick: There is a visible shooting star near the resistance zone—small body with a long upper wick—signaling a potential bearish reversal. This formation is more potent when appearing at elevated price levels, as it did here.
- Strong Resistance Zone: The region from 122,000 to 123,200 acts as a firm resistance, consistently rejecting price advances.
- Support Levels: Major support is evident around 115,000 and key psychological support at 112,000, serving as the neckline for the double top.
- Price Near All-Time Highs: Bitcoin is consolidating close to its prior record highs, maintaining a relatively tight range, which is common before a potential breakout or breakdown.
Implied but Not Visible on the Chart: Key Technical Indicators and Their Likely Signals
- Moving Averages (e.g., 50-day and 100-day EMA): Price remains above both the 50-day and 100-day EMAs, indicating the broader trend is still bullish. These moving averages have been reliable dynamic support in the recent uptrend.
- RSI (Relative Strength Index): Although not shown, price action near record highs and recent consolidation suggest that RSI may be hovering near or just above 70. This would imply overbought conditions and the risk of a correction.
- MACD: The persistence of higher prices and reduced momentum near resistance often coincide with the MACD histogram showing narrowing positive values and the potential for a bearish crossover.
- Bollinger Bands: Given the proximity to record highs and tight price action, the Bollinger Bands are likely to be relatively narrow, signaling a period of reduced volatility, often followed by a strong move.
- Volume: Recent commentary notes a substantial drop in volume, which is a warning for trend sustainability. Breakouts on low volume tend to have a higher probability of failing or reversing.
Prominent Chart Patterns and Candlestick Setups
- Double Top: Suggestive of a possible medium-term trend reversal if neckline support is lost.
- Shooting Star: Bearish reversal threat, particularly significant given its appearance at technical resistance.
- Absence of Bullish Reversal Candlesticks: No strong bullish reversal patterns are presently visible, increasing vulnerability to further selling if support levels are breached.
Current Trend Assessment
- Broad Uptrend: Price is still in a broader uptrend, as evidenced by its position above key moving averages and elevated above support levels.
- Short-term Neutral to Vulnerable: The presence of a double top and shooting star near resistance indicates caution. Unless price can overcome the all-time highs with strong volume, a reversal or correction back toward support is possible.
- Potential for Breakout or Breakdown: The compression of price near major highs with deteriorating momentum and volume sets the stage for a significant move. Breaking above 123,200 would confirm bullish continuation, while loss of 112,000 would trigger a deeper drawdown.
Major Support and Resistance Levels
- Resistance: 122,000 – 123,200 (all-time highs, psychological and technical barrier)
- Near-term Support: 118,000 – 115,000 (recent swing lows and congestion)
- Major Support (Double Top Neckline): 112,000
- Upside Target on Breakout: 125,000
- Downside Target on Breakdown: 108,000 and below
Additional Key Technical Insights
- Diminished Volume: The recent drop in trading volume warns that any significant move may lack conviction unless accompanied by a clear volume expansion.
- Momentum Shift: The combination of bearish candlestick formations and waning momentum indicators, like MACD and RSI, point to rising risks of a near-term correction.
- Market Sentiment: Mixed technicals at a pivotal price level suggest both bullish and bearish traders are waiting for confirmation from a breakout or breakdown.
Actionable Technical Outlook
BTCUSD is consolidating just below its all-time highs, with both bullish and bearish signals competing for dominance. The broader uptrend remains intact above 115,000, but a clear double-top pattern and a bearish shooting star at resistance raise the risk of a correction. Critical levels to watch are 123,200 for a bullish breakout (with upside to 125,000 or higher), and 112,000 as the breakdown threshold for a reversal. Until price resolves this range with strong volume, expect continued volatility and potential false breaks. Traders should remain nimble, prioritizing risk management with tight stops around these key technical zones.