


 |
| Gold V.1.3.1 signal Telegram Channel (English) |
EURUSD-Daily
2025-08-25 @ 13:08
Market Overview
EURUSD traded in a volatile range over the past week, finding support near 1.1630 and rebounding toward 1.1670. The main drivers were expectations of imminent Fed rate cuts, especially after dovish comments from Fed Chair Powell, which weakened the US dollar and triggered sharp swings. Mixed US inflation data and signs of slowing economic momentum contributed to the dollar’s softness. On the euro side, stable risk sentiment and signs of stabilization in external demand helped limit downside, even as European growth data remained mixed. Geopolitical developments, including renewed diplomatic efforts in Ukraine and easing energy prices, also supported the euro. Despite prevailing downward technical signals, the pair showed resilience above key support levels, suggesting further upside potential if US data confirms expectations of monetary easing.
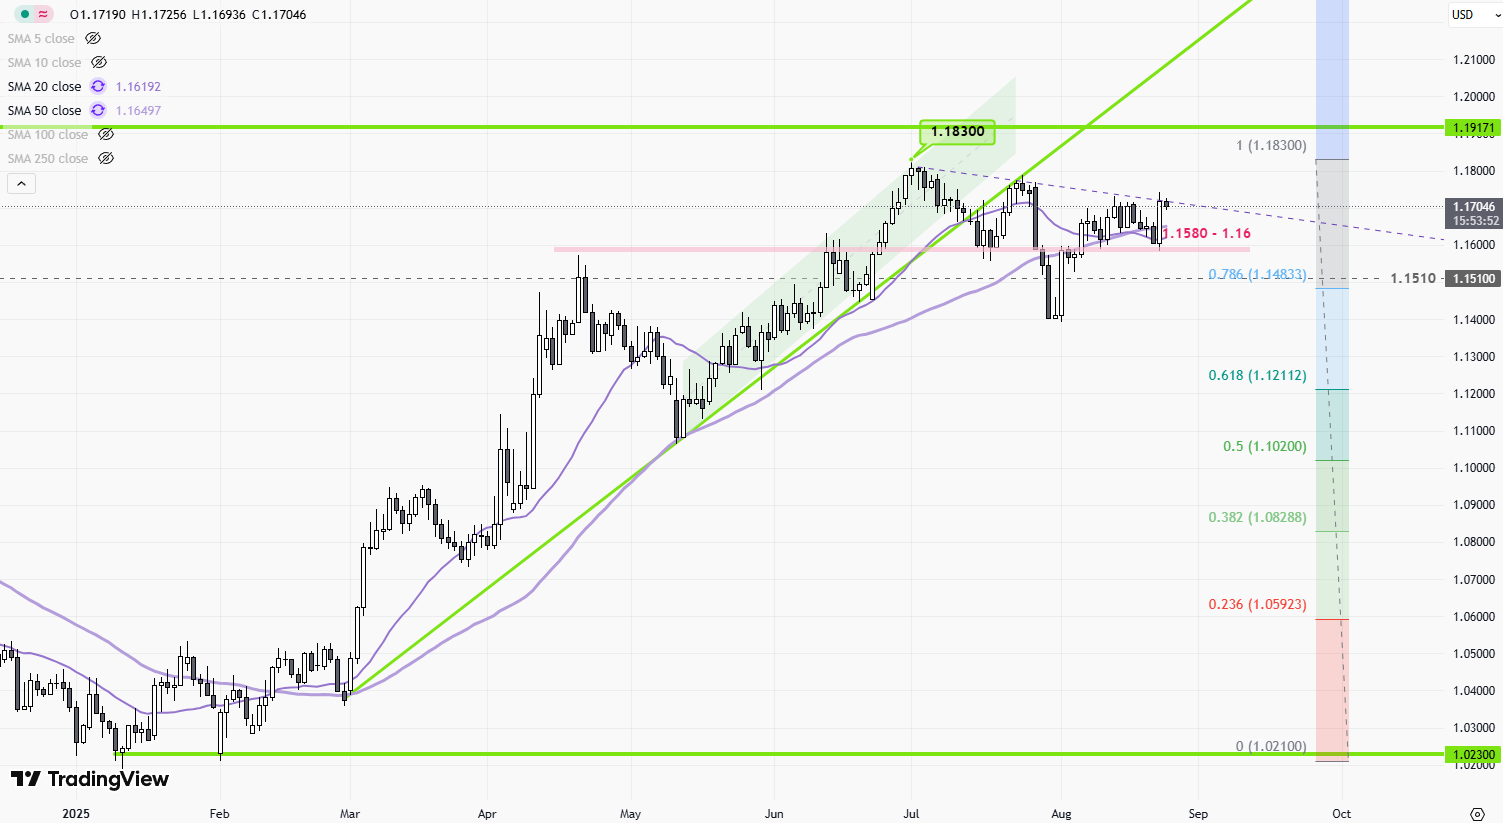
EURUSD Daily Candlestick Chart Technical Analysis (August 2025)
Observed Technical Patterns and Indicators on the Chart
- Price Action & Trend: EURUSD is in a broad, volatile sideways range with recent upward thrusts testing resistance near prior highs. The price action suggests repeated rejections in the 1.1750–1.1770 region, with multiple dips towards 1.1600–1.1570 support.
- Candlestick Patterns: Several large-bodied bullish candles emerged after tests of the 1.1600–1.1570 support. Most recently, wicks on both upper and lower ends (indecision candles) appear near resistance, indicating market indecision and a potential reversal or pause.
- Local Chart Patterns: No major textbook patterns (like head and shoulders, double tops) are visible. The chart shows a volatile box range with minor ascending price swings within the broader range.
Implied and Not-Shown Technical Indicators
- Moving Averages: The 50-day moving average (at approximately 1.1637) is acting as near-term support. Strength above this often points to bullish momentum, while repeated closes below would be bearish.
- RSI (Relative Strength Index): RSI is near the neutral (50) mark, implying neither overbought nor oversold conditions. This confirms the consolidation and lack of extreme momentum.
- MACD: Given the lack of strong recent trends, the MACD histogram would likely show convergence, with the signal and MACD lines close together, highlighting neutral momentum.
- Bollinger Bands: The price has recently fluctuated between the upper and lower bands. The current squeeze and frequent tag of both bands suggests increased volatility but no decisive trend emergence.
Pattern and Candlestick Recognition
- Doji Candles: Indicate market indecision near resistance levels, warning of possible short-term reversals.
- Bullish Engulfing (Prior Swings): Observed near the 1.1600–1.1570 support, validating these as key demand zones and suggesting buyers are defending them aggressively.
- No Confirmed Reversal Patterns: No clear head and shoulders, double top/bottom, or triangles are established in the current timeframe, but local higher lows signal growing buying interest on dips.
Assessment of Current Trend Direction
- Neutral to Slight Bullish Bias: The broader trend is sideways, bounded by 1.1570–1.1770. However, a series of higher lows suggests latent bullishness. For a decisive uptrend to commence, a daily close above 1.1770 is required. A close below 1.1570 would confirm downside continuation.
Major Support and Resistance Levels
- Support:
- 1.1650 (near-term, 50-day MA)
- 1.1600–1.1570 (multi-week demand zone)
- 1.1500 (longer-term structural support)
- Resistance:
- 1.1740–1.1770 (swing highs/pivot resistance)
- 1.1810 (historical resistance)
- 1.1900 (if breakout accelerates)
Additional Technical Insights
- Volatility and Momentum: The emergence of large candles at support followed by indecision candles at resistance indicates a market in transition. Volume data, if available, would confirm whether breakouts are genuine. Momentum remains lackluster, awaiting a fundamental or technical catalyst.
- Sentiment and Market Triggers: Geopolitical news (e.g., talks involving the US, Russia, and Ukraine, as mentioned broadly in recent analysis) can quickly shift the directional bias, so traders should remain alert to headline risk.
Actionable Summary
- EURUSD remains in a wide consolidation between 1.1570–1.1770, with a neutral to slightly bullish technical outlook.
- Key support at 1.1600–1.1570 is critical—bullish engulfing candles here suggest demand, and long positions can be considered with stops below the support.
- Short-term resistance at 1.1740–1.1770 should be monitored for rejections; a confirmed breakout above opens the path to 1.1810 and 1.1900.
- If price closes below 1.1570, momentum will likely turn decisively bearish, targeting 1.1500 or lower.
- Watch for a confirmed daily trendline break or a strong daily close outside the current range for directional cues. Volume spikes and reaction to macroeconomic news may provide early signals of the next trend’s direction.
This is a range-trading environment until proven otherwise; fade extremes and watch for confirmed breakouts at the boundaries of the current structure.