


 |
| Gold V.1.3.1 signal Telegram Channel (English) |
GBPUSD-Daily
2025-08-25 @ 13:12
Market Overview
GBP/USD experienced notable volatility over the past week, initially dipping to lows near 1.3390 before rebounding and ending the week around 1.3527. This movement was driven by a mix of UK economic data, including softening domestic demand and persistent concerns about the labor market, which fueled speculation of earlier Bank of England rate cuts. Meanwhile, declining inflation and cautious consumer sentiment weighed on the pound’s appeal. The dollar’s strength was supported by resilient US data and Federal Reserve communication suggesting restrictive policy. However, a sudden surge in GBP/USD occurred after Fed Chairman Powell indicated a potential US rate cut in September, swiftly shifting sentiment and boosting sterling against the greenback. Overall, GBP/USD remains sensitive to central bank policy signals and evolving inflation figures as traders adjust positions on shifting interest rate expectations.
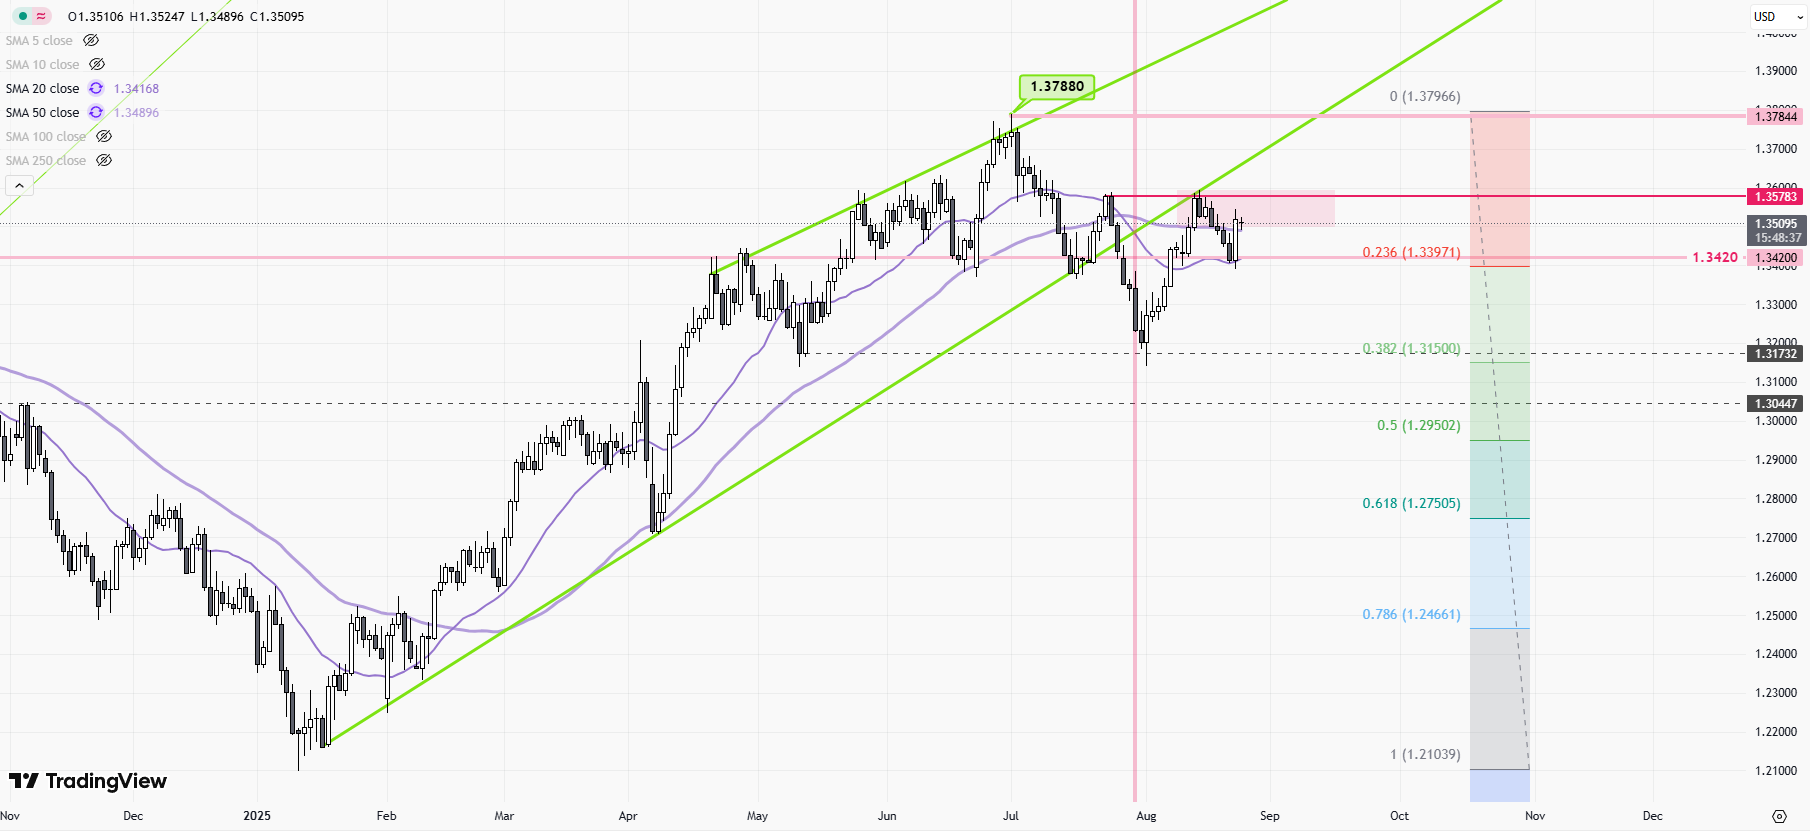
GBPUSD Daily Chart Technical Analysis
The recent GBPUSD daily chart illustrates notable volatility, transitioning from late-week bearish momentum into a sharp bullish reversal driven by macro events such as the Fed’s Jackson Hole Symposium. Here’s a comprehensive breakdown based on the chart and implied technical signals.
Visible Technical Patterns & Indicators on Chart
- Candlestick Patterns: A series of long-bodied bearish candles dominated earlier sessions, culminating in pronounced downside test near the 1.33910 level. This was followed by an impulsive bullish candle, indicative of a potential reversal or a short-term bottom.
- Support & Resistance: The 1.33910 area has acted as a major support, frequently tested and defended. Immediate resistance materialized near 1.35275, where price closed into the weekend.
- Trend Structure: The overall price action last week consisted of a strong downtrend, arrested sharply by a bullish impulse, suggesting heightened volatility and an evolving market sentiment.
Implied Technical Indicators (Not Directly Shown)
- Moving Averages (200-Day EMA): Price action approaching the 1.3175 level would encounter significant dynamic support, provided by the 200-day EMA. Any sustained move above this zone often signals trend reversal or affirmation of upward momentum.
- RSI (Relative Strength Index): Given recent sharp declines followed by rapid rebounds, RSI likely bottomed near oversold territory, signaling a favorable risk-reward setup for bullish traders.
- MACD (Moving Average Convergence Divergence): Momentum metrics would reflect a bearish cross during the sell-off, with the potential for a bullish re-cross as recovery unfolds, supporting the reversal thesis.
- Bollinger Bands: Volatility expansion is visible, with price likely pressing the lower band during the sell-off and snapping back toward the central band amid the rebound, signaling mean reversion.
Notable Chart & Candlestick Patterns
- Double Bottom Formation: Multiple retests of the 1.33910 level without a decisive breakdown indicate a developing double bottom – a classic reversal structure.
- Engulfing Pattern: The large bullish candle following Friday’s low fully engulfs the previous session’s range, an unmistakable bullish engulfing pattern, signaling possible upward continuation and strong demand influx.
- Doji Candle, Hammer, and Reversal Signs: Absence of clear doji or hammer formation on the reviewed daily chart, but the prevailing sharp reversal and long lower wick on the pivotal reversal candle are reminiscent of capitulation and reversal setups.
Trend Assessment
The chart moved from a clear downtrend dominated by persistent selling to a short-term upward reversal following the pivotal macro event. This transitioning structure suggests the downtrend may have ended, giving way to either a corrective rally or fresh uptrend depending on further confirmation.
Major Support & Resistance Levels
- Primary Support: 1.33910 remains crucial; a break below exposes 1.3250 and then 1.3175 as deeper supports.
- Immediate Resistance: 1.35275 is the first bullish target. Further resistance lies at the weekly high of 1.35500 and then 1.36.
- The price envelope between 1.3175 and 1.35500 encapsulates most recent key pivots and should guide near-term positioning.
Additional Insights
- Momentum & Volume: While explicit volume data is not present, the abrupt reversal and strong candle bodies imply a momentum shift, likely fueled by increased market participation after the Fed statement.
- Risk Events: Macro news—such as Powell’s dovish signals—can override technical setups temporarily, but technical edge is regained as markets digest fundamental shifts.
Actionable Summary
GBPUSD’s technical outlook has turned neutral-to-bullish after surviving a deep sell-off and igniting a reversal at major support. Near-term risk favors a corrective move toward 1.35275–1.35500, with 1.33910 and 1.3175 as essential downside supports. Technical indicators (both shown and implied) point toward recovering momentum, though caution is warranted around macro news flow. Trading strategies should emphasize support buying and breakout confirmation above resistance, while monitoring signals for exhaustion and further reversal.