


 |
| Gold V.1.3.1 signal Telegram Channel (English) |

Gold Price Forecast September 2025: XAU/USD Technical Analysis and Key Support-Resistance Levels
2025-09-24 @ 20:00
Gold Analysis: XAU/USD Technical Outlook for September 24, 2025
Gold remains a focal point in the global financial markets, consistently attracting investor attention due to its role as a hedge against inflation and economic turbulence. As of September 24, 2025, price action and technical structure suggest gold’s bullish momentum continues to dominate across all key timeframes, even while signs of short-term exhaustion begin to emerge.
Current Price Structure and Trend
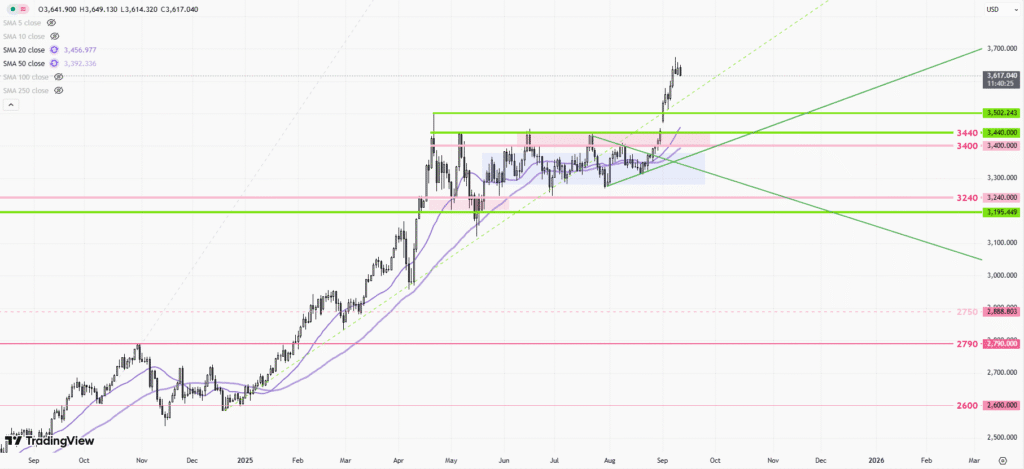
On the monthly, weekly, daily, and intraday charts, gold (XAU/USD) exhibits a clear uptrend. Each timeframe shows persistence in upward movement, underpinned by strong demand from both institutional and retail investors. The latest moves have pushed prices into an overextended territory, but momentum remains firmly with the bulls.
The present rally sees gold trading beyond the 338% Fibonacci extension level. While some may view this as a sign of being overbought, historically, such technical extensions are not reliable predictors of an imminent reversal. Markets, especially those with strong underlying fundamental support, can remain overextended longer than many anticipate.
Technically, the price action displays a classic five-wave impulsive structure, characteristic of Elliott Wave theory’s trending sequences. As long as this pattern persists—without a clear double top or significant structural breakdown—the upside bias is likely to continue.
Key Support and Resistance Levels
- Immediate Support Zone: 3,733–3,725
This area has acted as a springboard for the current rally. If the market retraces, traders should monitor this zone closely for fresh buying interest and potential stabilization. - Next Major Target (Resistance): 3,826–3,810
Bullish targets are now clustered around this zone. If momentum persists and gold breaches resistance, this range could become the next inflection point where sellers may seek to halt further advances. -
Short-Term Resistance: Price is currently testing psychological and technical resistance levels set by previous swing highs and heavily traded zones. A decisive breakout above the 3,810 area may trigger additional bullish flows, extending the move toward higher Fibonacci extension levels.
Intraday and Short-Term Outlook
Intraday price action remains constructive for long positions, with momentum supported by favorable global macroeconomic conditions and active flows into safe-haven assets. While profit-taking has been observed at recent highs, the retracements have remained orderly and shallow, reinforcing the underlying bullish theme.
Should gold establish a double top formation on lower timeframes—paired with a breakdown in structure—that would signal the beginning of a corrective phase. Until such confirmation appears, short trades should be approached cautiously.
Trading Strategy Considerations
- For trend-following traders, the path of least resistance is still upward. Pullbacks toward the established support zones can offer attractive entry points for new long positions.
- Risk management is critical. Given gold’s overextended position, traders should closely monitor stop levels and be prepared for increased volatility, especially as the market tests major resistance.
- Investors looking for confirmation of a trend reversal should watch for decisive closes below 3,725 and validated double top patterns with follow-through selling.
Macro Factors Driving Demand
Gold’s robust performance aligns with macroeconomic variables such as persistent inflation fears, geopolitical friction, and central bank accumulation. These factors provide a fundamental floor beneath the technical structure, driving both speculative and long-term investment flows.
In addition, market participants have increasingly turned to gold amid uncertainty surrounding global monetary policy adjustments. With many central banks holding rates steady or signaling future easing, gold maintains its reputation as a portfolio anchor and volatility dampener.
Conclusion and Forward Guidance
Gold’s multi-timeframe uptrend remains intact, and technical signals continue to reinforce the bullish bias. While overextension increases the risk of abrupt corrections, current structures favor opportunistic buying until proven otherwise. Watch for key resistance in the 3,810–3,826 zone and remain alert to price action around support for clues to potential trend shifts.
As always, disciplined risk management and keeping abreast of fundamental drivers will be essential for navigating the gold market in the weeks ahead. Whether you are positioning for further upside or seeking signs of an imminent correction, vigilance and adherence to tested strategies will reward patient traders in this dynamic environment.