


 |
| Gold V.1.3.1 signal Telegram Channel (English) |
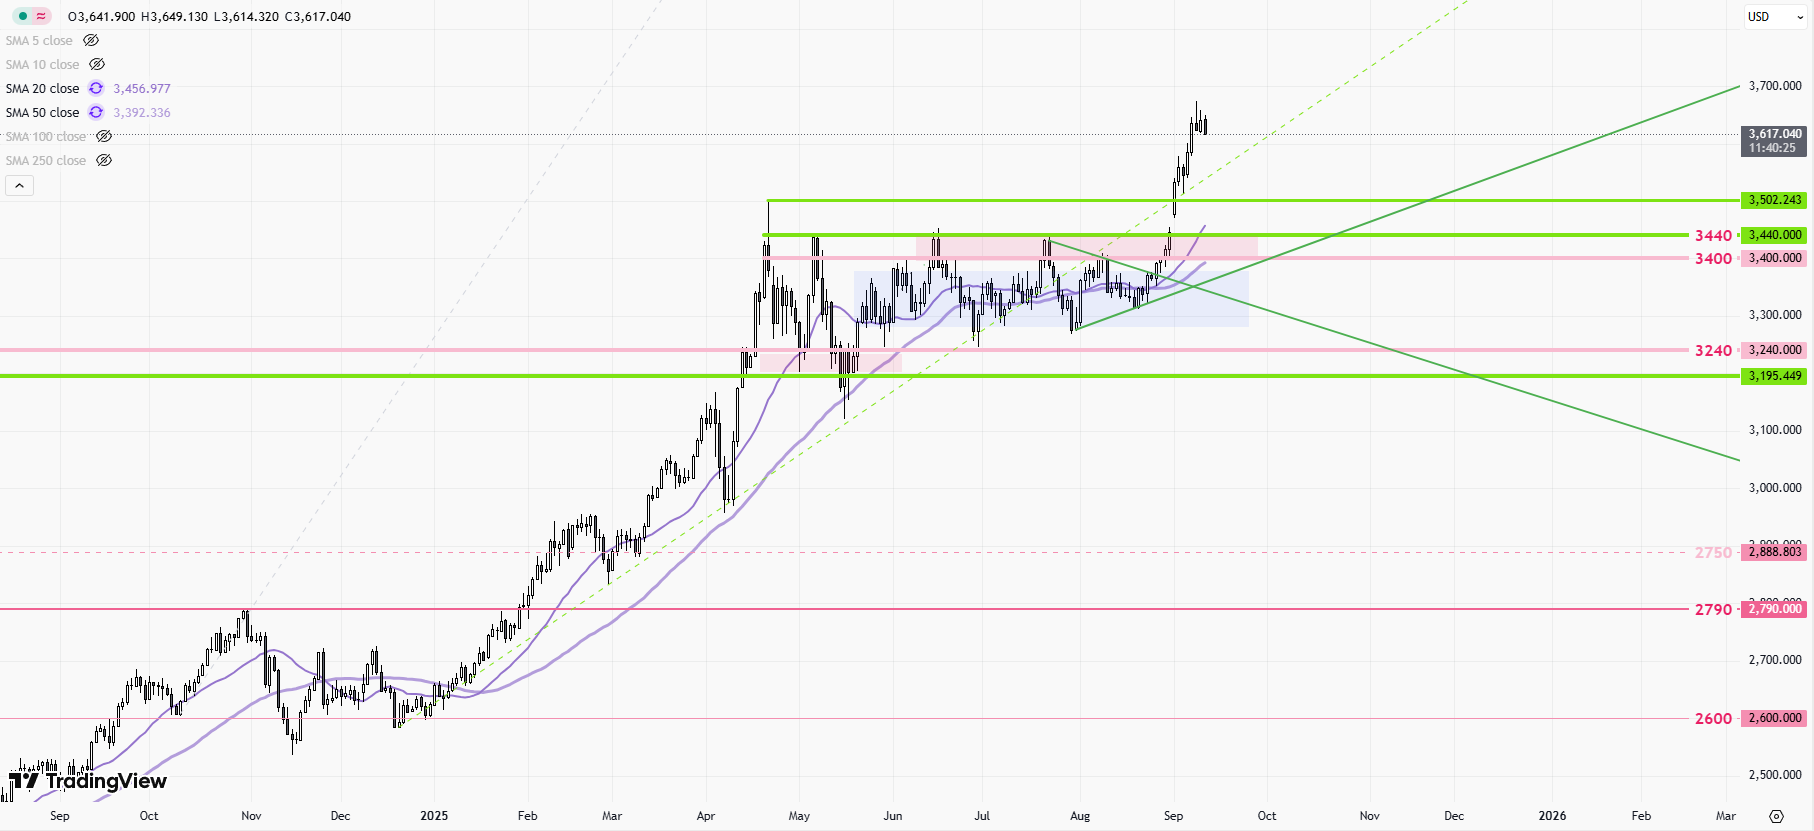
XAUUSD-Daily Chart
2025-09-11 @ 17:21
Summarize this blog post with:
Market Overview
Gold (XAUUSD) surged to record highs this week, peaking near $3,674 before a modest correction. The rally was driven by heightened expectations for imminent U.S. Federal Reserve rate cuts after weak employment data and falling Treasury yields, which lowered the opportunity cost of holding gold. Added momentum came from increased safe-haven demand due to ongoing geopolitical tensions and robust central bank purchases. As markets await key U.S. inflation reports, gold prices are consolidating near their highs, with further upside possible if rate cuts materialize and economic uncertainty persists. Market sentiment remains strongly bullish, with analysts forecasting continued gains into year-end.
Gold (XAUUSD) has recently reached new all-time highs, showing dominant bullish momentum on the daily chart. The price action is marked by strong upward movement, minor corrections, and ongoing positive sentiment from both technical and fundamental drivers.
Technical Patterns and Indicators Visible on the Chart
- Dominant Uptrend: Recent price action confirms a well-defined uptrend, characterized by higher highs and higher lows with a steep bullish acceleration.
- Strong Bullish Candles: Recent daily candles are large and bullish, reinforcing momentum.
- Minor Pullbacks: Intermittent small-bodied candles indicate brief corrections amidst the larger bullish swing.
Implied Technical Indicators and Their Signals
- Relative Strength Index (RSI): RSI is implied to be in the overbought zone, with recent readings reported around 75. Such a high RSI typically indicates potential overextension, but in the context of strong trends, overbought can persist for considerable periods as buyers dominate.
- MACD (Moving Average Convergence Divergence): The MACD remains strongly positive, reinforcing the bullish trend. Momentum, however, may be at risk of peaking soon if there’s significant profit-taking.
- Moving Averages: Although not shown, short-term and long-term moving averages (such as the 20-day and 50-day MA) would almost certainly be sloping sharply upwards, showing clear bullish alignment with the price far above key averages and no signs of crossover threats.
- Bollinger Bands: The price likely trades at or above the upper Bollinger Band, highlighting the strength and possible overextension of the move.
Prominent Chart and Candlestick Patterns
- Ascending Channel: The steep angle of ascent since the late August low at $3,404 forms a minor ascending channel that currently governs price action. Breaking this channel to the downside would be the first warning of a larger pullback.
- No Reversal Patterns: There is no clear evidence of reversal formations such as head and shoulders, double tops, or bearish engulfing clusters near the recent record highs.
- Continuation Patterns: The lack of large upper wicks or indecisive doji at resistance suggests bulls remain firmly in control for now.
- Candlestick Watch: Should a doji, shooting star, or bearish engulfing candle emerge near resistance, it would be an early warning of a possible pause or retracement.
Trend Assessment
- Trend Direction: XAUUSD is in a strong, accelerating uptrend, with no clear signs of trend exhaustion yet.
- Momentum: Despite being overbought, momentum remains robust. Minor corrections are being met with renewed buying.
Support and Resistance Levels
- Major Resistance:
- All-time high: $3,674–$3,685
- Next projection and Fibonacci cluster: $3,697–$3,725
- Major Support:
- Immediate: $3,620–$3,600 (first line of defense)
- Deeper pullbacks: $3,561 and $3,536 (structural supports from previous price consolidation)
- Key pivotal trendline and channel support: $3,500
Additional Technical Insights
- Volume Trends: While not shown, such breakouts to historical highs often see volume spikes. Sustained high volume would confirm institutional buying; declining volume as prices advance could signal caution.
- Momentum Shifts: If the price abruptly fails at resistance or posts a reversal candle on high volume, it could mark the start of profit taking or a deeper correction.
Actionable Technical Outlook
Gold remains in a powerful uptrend, reinforced by record highs and strong bullish sentiment, but technical overbought conditions (as suggested by RSI and persistent upper Bollinger Band testing) warn of possible short-term volatility, profit-taking, or a brief consolidation. Traders should watch for:
– Signs of reversal or momentum loss near $3,674–$3,685.
– Support holding at $3,600–$3,620 for renewed buying opportunities.
– A daily close below $3,600 as an early warning of larger corrective potential toward $3,561–$3,500.
As long as momentum persists and $3,600 remains intact, the path of least resistance remains upward, targeting new highs in the $3,700s. However, vigilance for reversal patterns or a break below channel support is warranted given the extreme overbought technical backdrop.