


 |
| Gold V.1.3.1 signal Telegram Channel (English) |

AUDUSD: Support, Resistance and Trading Setup
2025-11-09 @ 23:12
Over the past three trading days, AUDUSD has faced intense selling pressure, closing yesterday at 0.65137 despite brief intraday highs. Market volatility has been driven by global equity sell-offs, heightened US-China tech tensions, and the Australian central bank’s hawkish stance—factors weighing heavily on the Aussie. With no major bullish catalysts in recent headlines, buying momentum remains weak. The story for average investors: the Australian dollar is acting as a risk barometer and continues to struggle as sentiment sours. Price action near the 0.65 handle and persistent rejections signal technical bearishness, making downside risk the key focus of this AUDUSD Price Analysis.
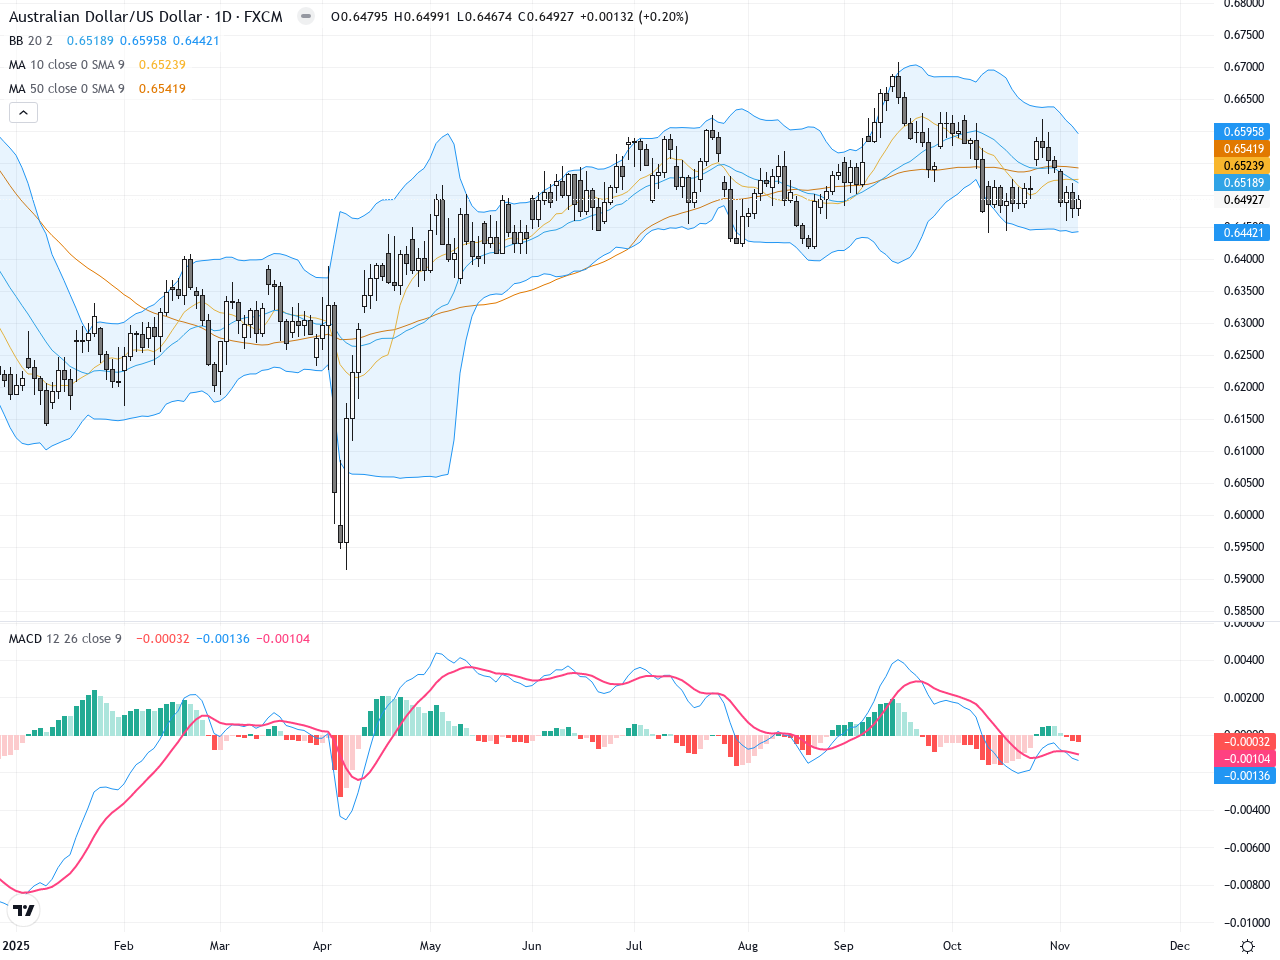
The daily chart for AUDUSD shows price locked below short and medium-term moving averages, with 3 consecutive bearish candles marking out a persistent downtrend. MACD histogram remains negative, and moving averages are diverging, further favoring bears. Bollinger Bands are widening downward, with price sticking to the lower band. A developing small Head and Shoulders pattern emerges, with further downside likely if 0.6450 breaks, targeting 0.6420 and potentially lower. No significant reversal signals are present, confirming the bearish bias.
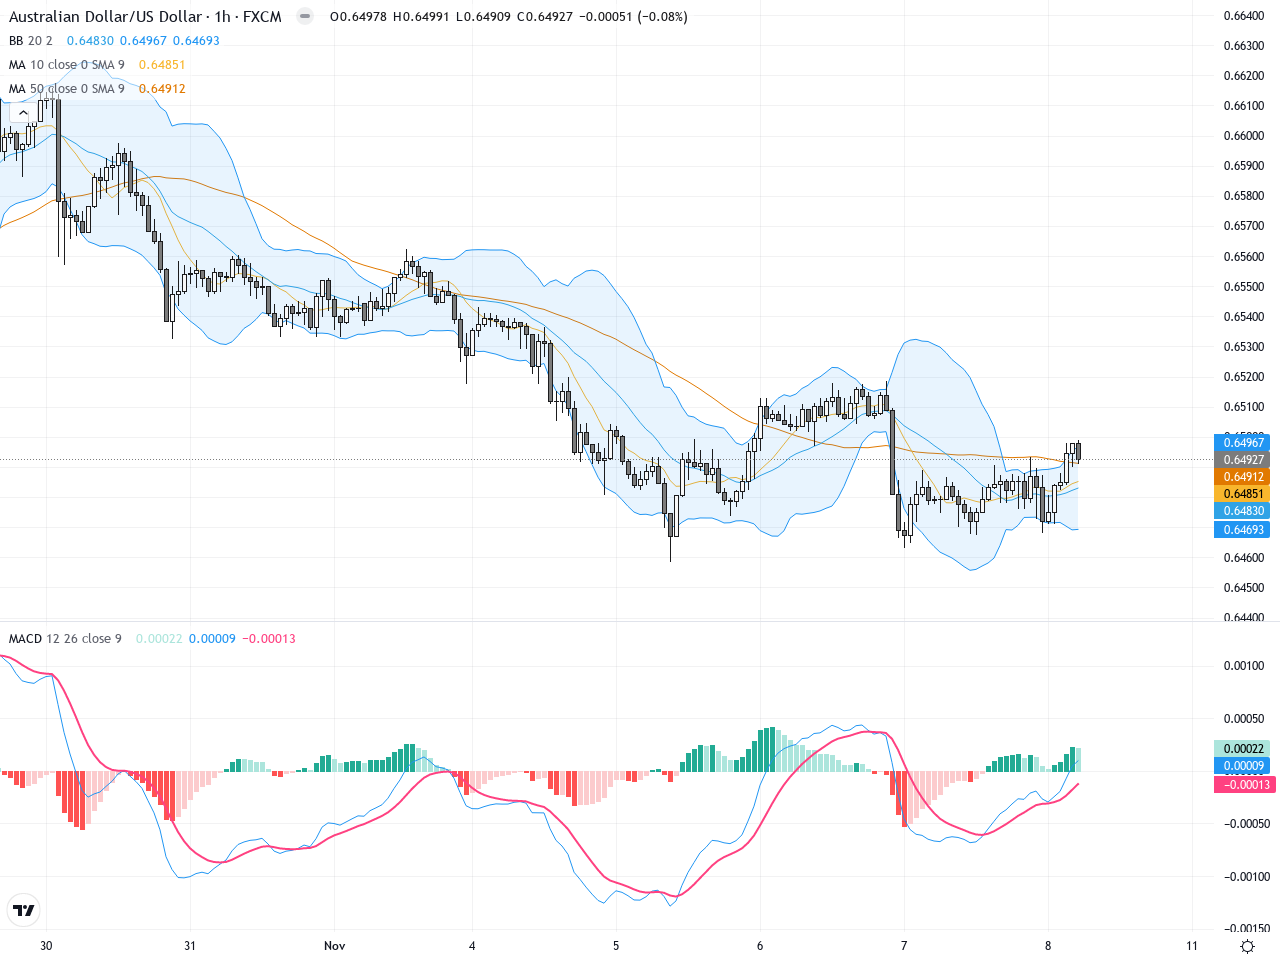
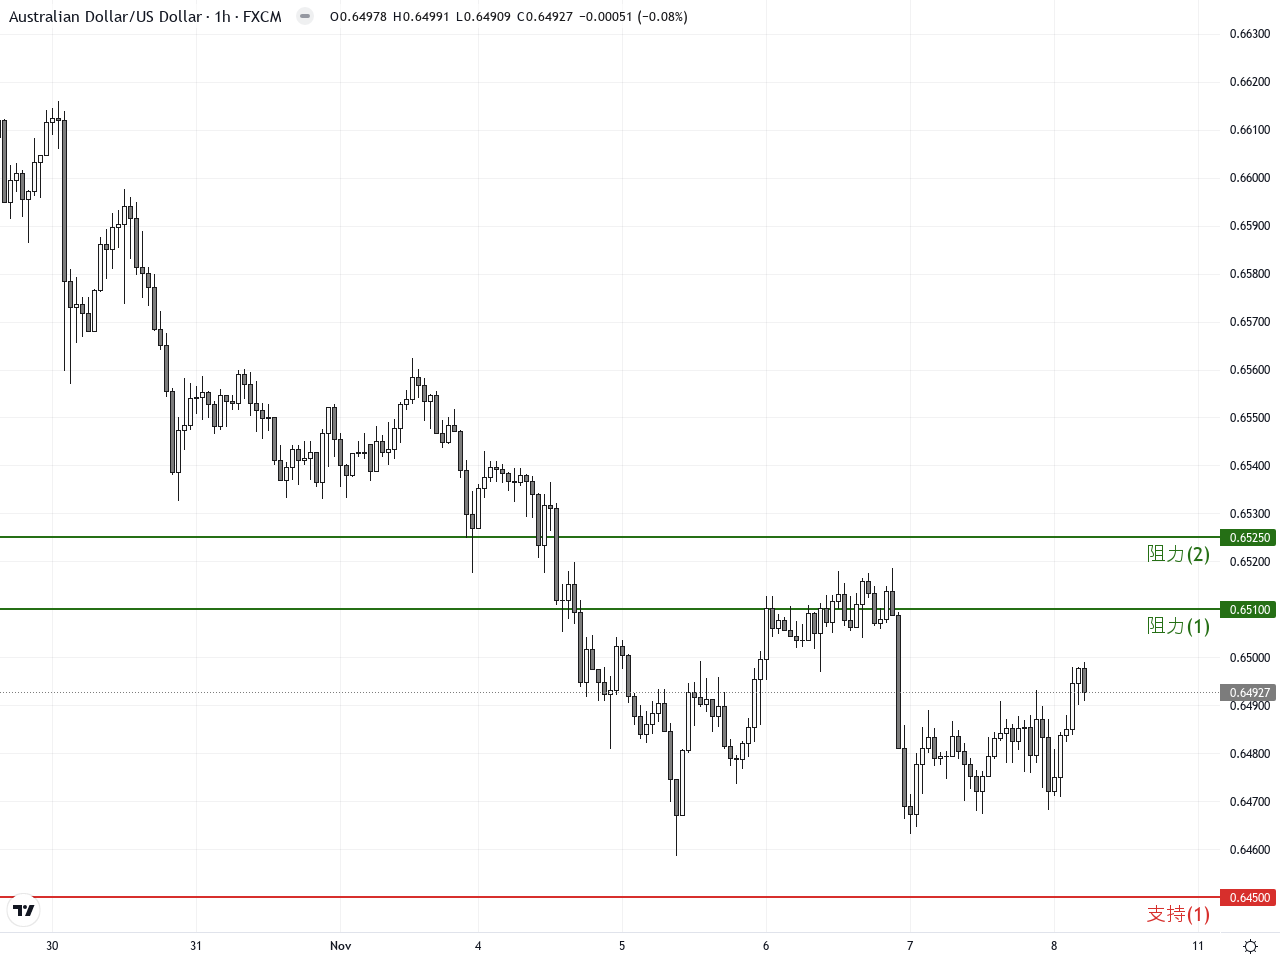
The hourly chart reflects brief rebounds in AUDUSD, but each attempt above 0.6510-0.6525 faces heavy and immediate selling. Short-term MACD golden crosses have failed to hold, while the 60MA and 200MA continue to cap upside. The last 4-hour candlestick forms an inverted hammer/spinning top with a long upper shadow, reinforcing fading bull momentum and renewed seller control. Eyes now turn to the 0.6450 support—failure here opens the door for another sharp downward leg.
Technical Trend: Bearish bias
Key technical insight: Overlap of a nascent Head and Shoulders top with multiple failed rebounds signals exhausted upside, while MACD and trend indicators remain negative. The latest candlestick cluster above 0.6510 forms a Dark Cloud Cover, hinting at further pressure in the hours ahead. If there’s no significant rebound at the next Asian open, expect downside continuation—short setups look attractive below 0.6500, provided risk controls are in place.
Resistance & Support
The above financial market data, quotes, charts, statistics, exchange rates, news, research, analysis, buy or sell ratings, financial education, and other information are for reference only. Before making any trades based on this information, you should consult independent professional advice to verify pricing data or obtain more detailed market information. 1uptick.com should not be regarded as soliciting any subscriber or visitor to execute any trade. You are solely responsible for all of your own trading decisions.