


 |
| Gold V.1.3.1 signal Telegram Channel (English) |

BTCUSD: Triangle Consolidation Signals Potential Breakout Opportunity
2025-11-17 @ 22:36
BTCUSD: Triangle Consolidation Signals Potential Breakout Opportunity
Over the past three trading days, BTCUSD demonstrated notable volatility around the 94400 level, closing yesterday at 94433.96 USD, close to a key support zone. With no major market news driving price action recently, technical analysis reveals BTC forming an important triangle consolidation pattern, indicating accumulating momentum for an imminent breakout. For everyday investors, this means patience and risk management are crucial while awaiting a clear directional move. Market news today centers mainly on economic data from Japan and Europe, which have limited direct impact on BTC but maintain macroeconomic influence on crypto prices. Overall, BTCUSD is approaching a critical resistance level on the charts, signaling traders should watch closely for potential swings and adjust their positions accordingly.
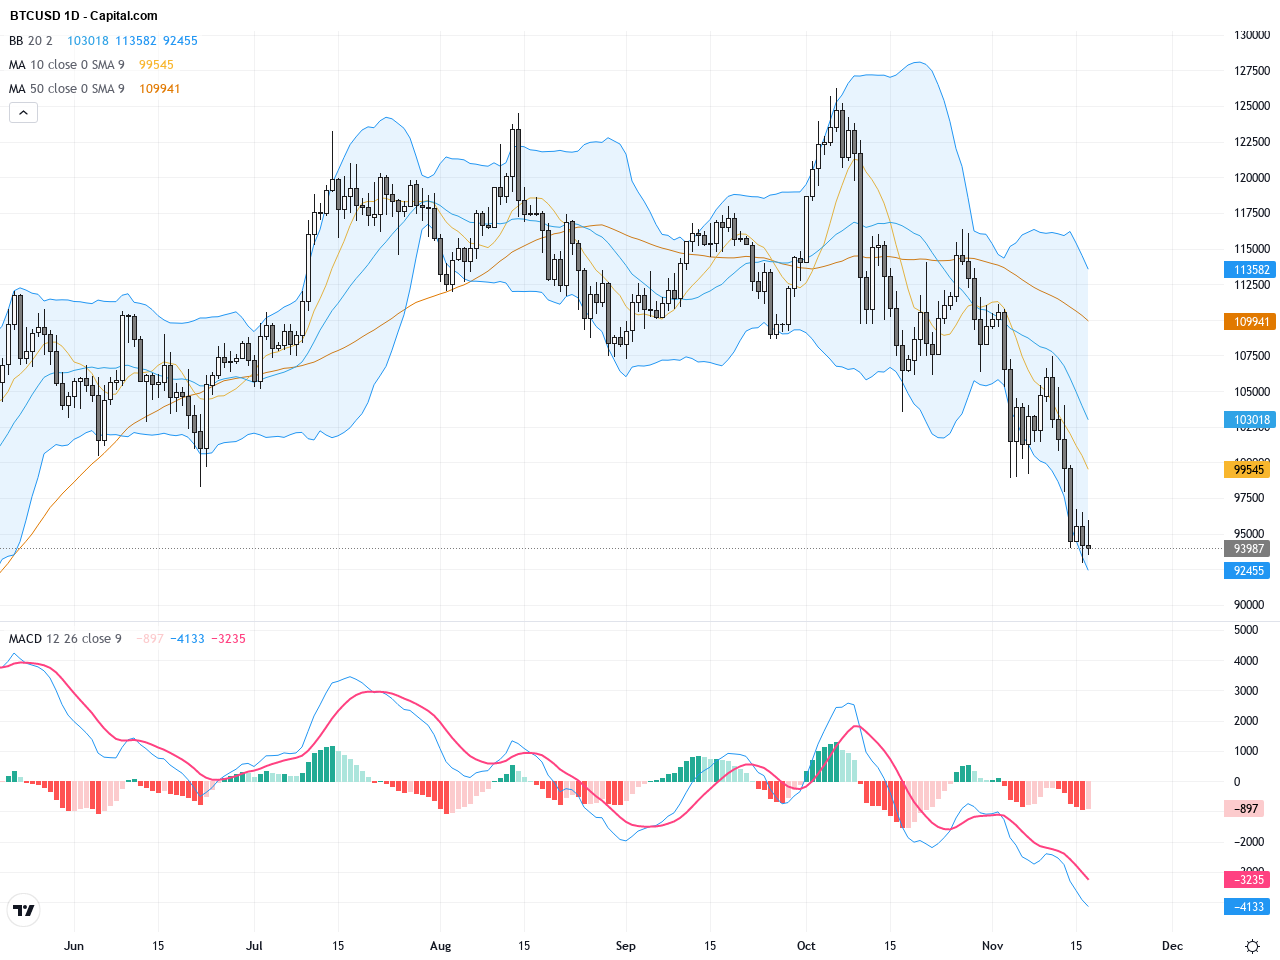
The BTCUSD daily chart over the last 20 trading days highlights a clear triangle consolidation pattern, with price gradually compressing near the highs. Both 20-day and 50-day moving averages are flattening, and price hovers near the Bollinger Bands’ middle band. The MACD indicator sits just above zero with no definitive crossover yet. The overall daily trend shows waning bullish momentum and a clear consolidation phase, awaiting confirmation of a breakout direction.
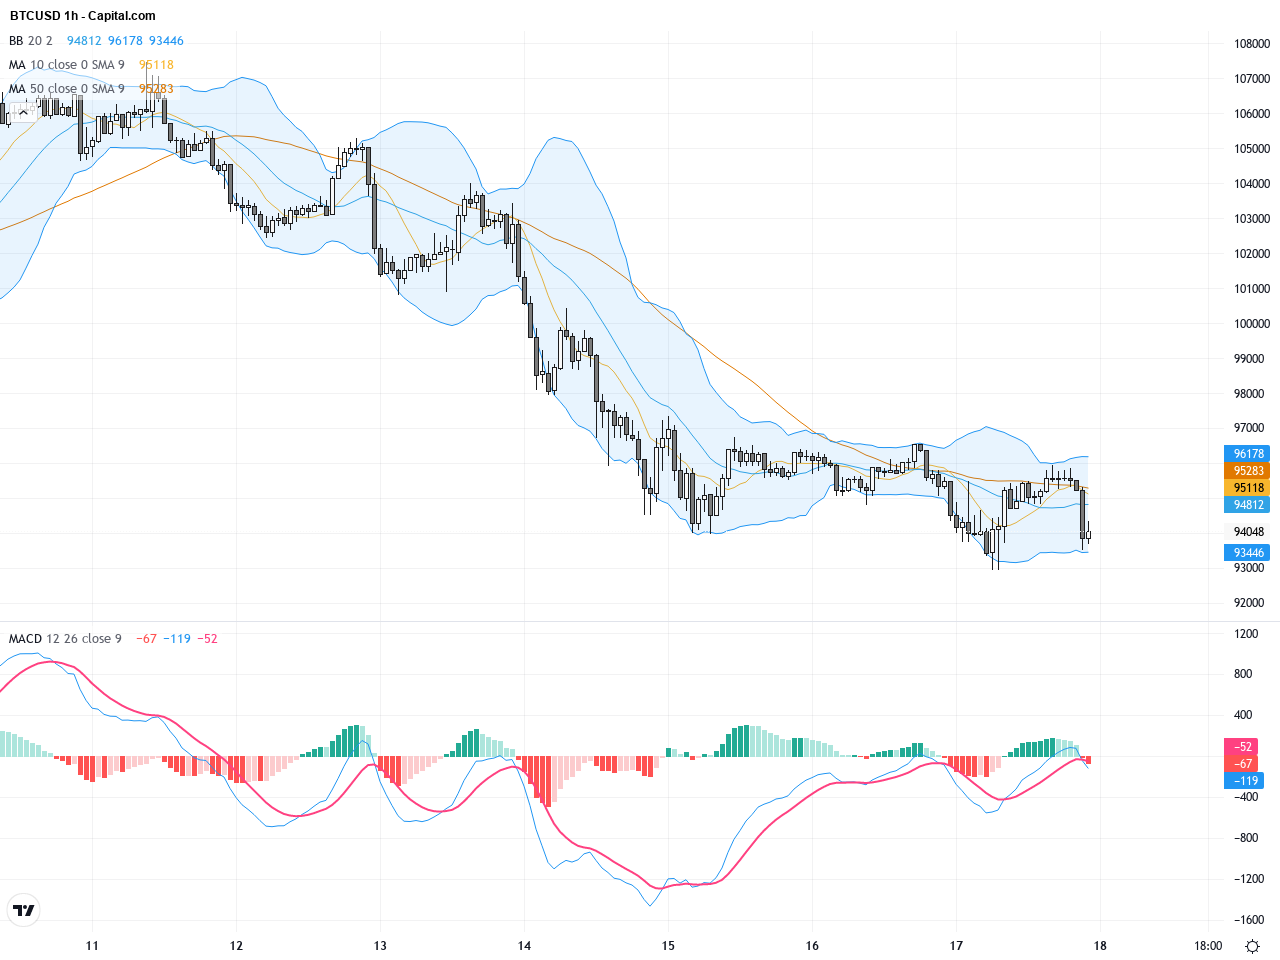
On the hourly chart, BTCUSD shows clearer short-term volatility and breakout attempts within the past 3-5 days. The 50 and 200-period moving averages have recently crossed, indicating mild short-term bullish momentum. Bollinger Bands are tightening, suggesting decreased volatility. MACD formed a bullish crossover while RSI hovers around 50, signaling mild bullish conditions. A recent bullish engulfing candlestick pattern implies a potential upward push in the next 24 hours.
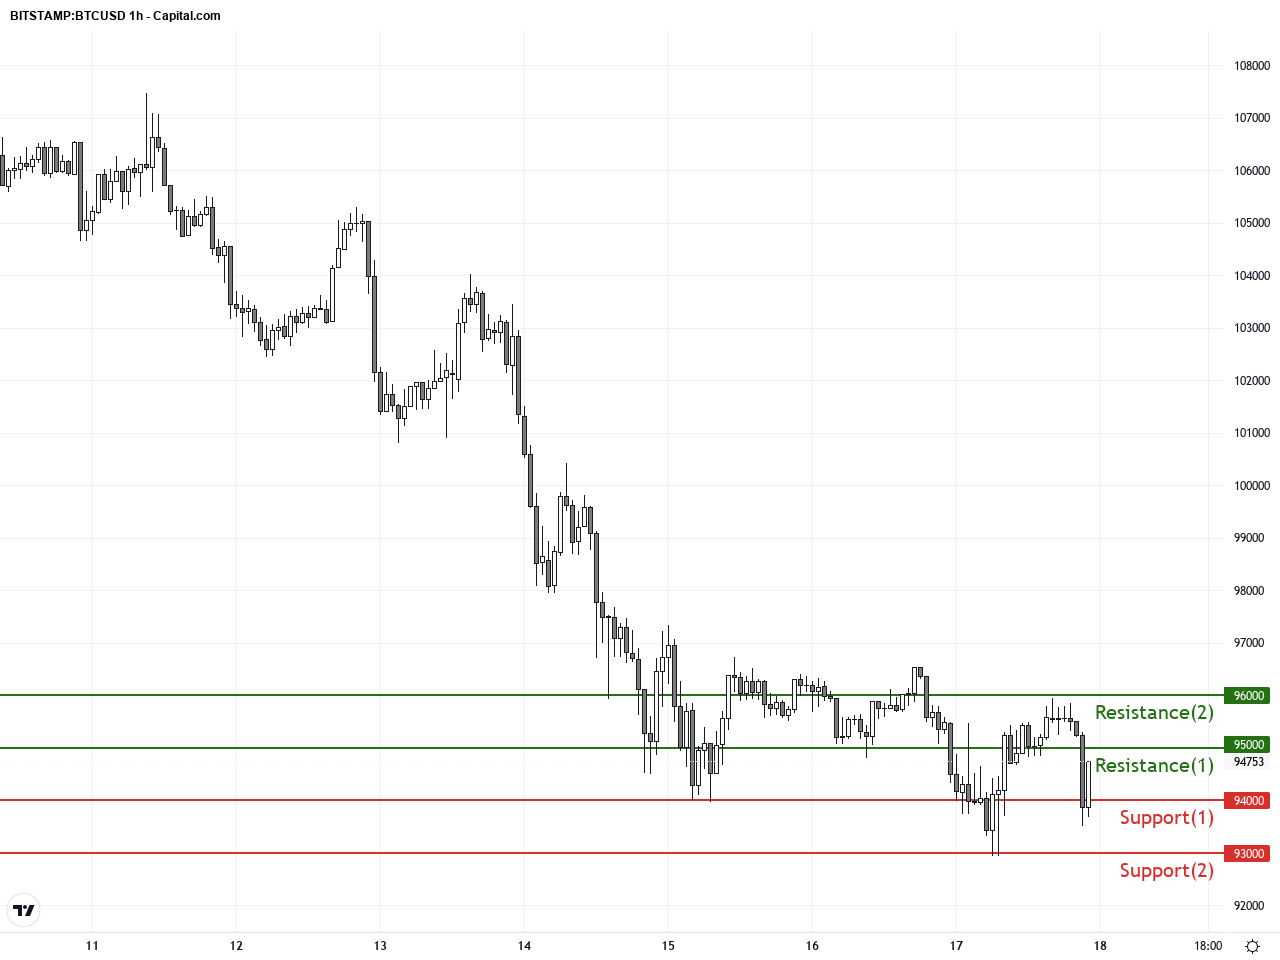
Technical Trend: The current trend direction is best classified as a ‘Cautiously Consolidating’ phase, neither a clear uptrend nor downtrend, awaiting a breakout above key resistance around 95000 USD for further confirmation.
Technically, BTC is within a distinct triangle consolidation zone, a pattern often preceding significant momentum shifts. Daily MACD remains mildly bullish without divergence, cautioning against false breakouts. On the hourly timeframe, the tightening Bollinger Bands and MACD bullish crossover along with the recent bullish engulfing candlestick suggest a potential short-term rebound. Volume remains cautious, so traders should watch for volume spikes to confirm trend continuation.Today’s economic calendar is focused on Japan’s Q3 GDP and industrial production data showing mild recovery signs, with limited direct effect on BTCUSD. European consumer price indices and the US NY Empire State Manufacturing Index are also released, representing broad macro factors but unlikely to produce immediate impact on BTC price. There are no major economic events directly affecting the cryptocurrency market today, so traders should rely primarily on technical analysis.
Resistance & Support
<
p style=”padding: 10px; margin: 20px 0; border: solid 1px #fa003f; border-radius: 5px;”>The above financial market data, quotes, charts, statistics, exchange rates, news, research, analysis, buy or sell ratings, financial education, and other information are for reference only. Before making any trades based on this information, you should consult independent professional advice to verify pricing data or obtain more detailed market information. 1uptick.com should not be regarded as soliciting any subscriber or visitor to execute any trade. You are solely responsible for all of your own trading decisions.