

 |
| Gold V.1.3.1 signal Telegram Channel (English) |

EURUSD: Fresh Weekly Trading Outlook, Technical Signals & Key Fundamental Shifts
2025-11-10 @ 15:58
EURUSD: Fresh Weekly Trading Outlook, Technical Signals & Key Fundamental Shifts
EURUSD demonstrated notable volatility over the past three trading days, with a latest close at 1.15712—slightly higher from yesterday. Although no major news headlines hit the tape this week, the market’s price movement reflected uncertainty ahead of eurozone and US data releases. This drove EURUSD to trade between 1.149 and 1.159, making investors feel the quintessential end-of-reporting season tension. Active traders are tightly focused on crucial support and resistance, bracing for quick breakouts or reversals. With markets awaiting new catalysts, this choppy action is likely to persist. Technically, EURUSD exhibits a fresh divergence worth attention.
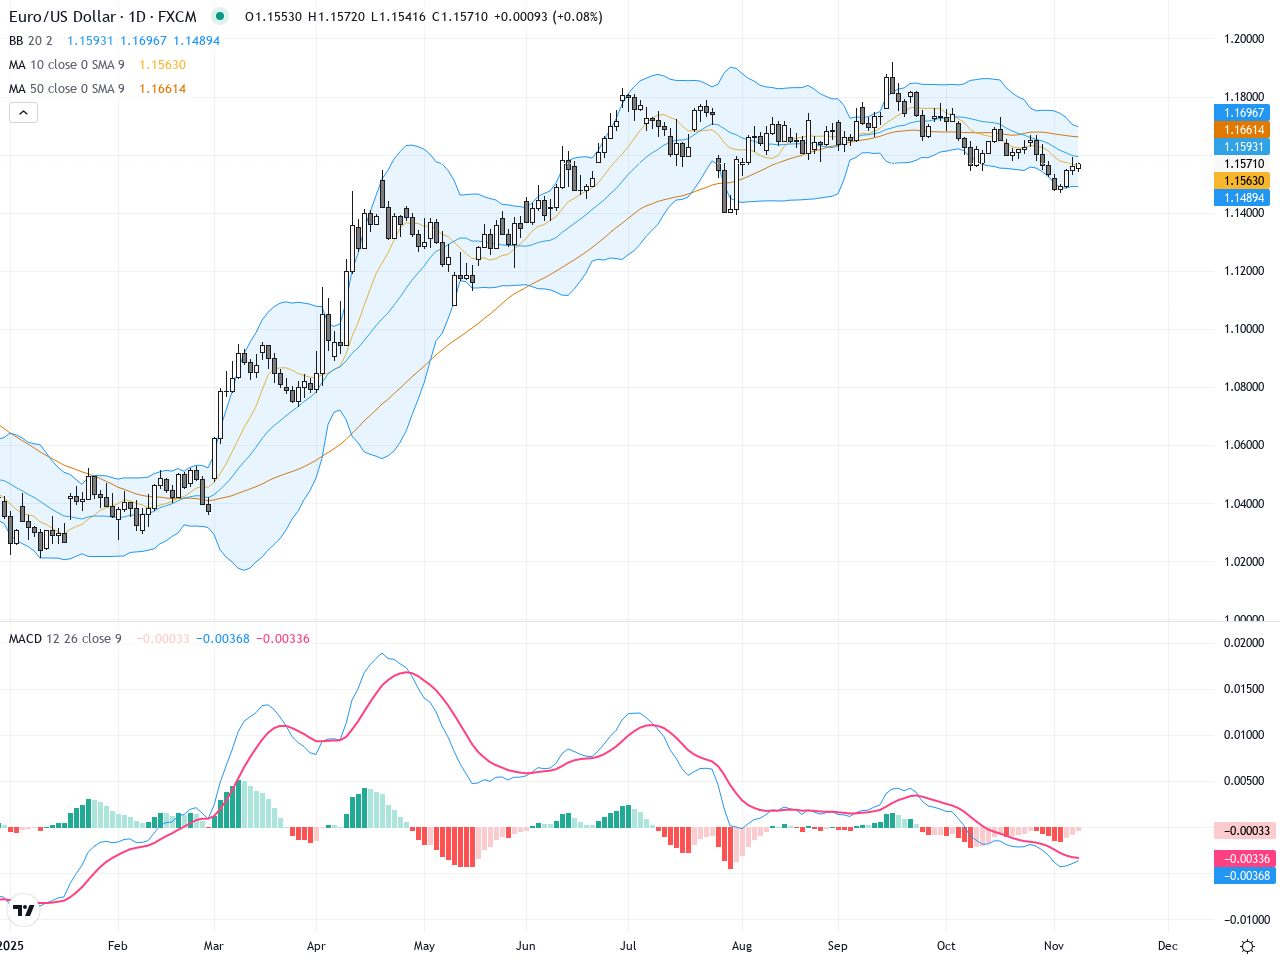
The daily chart reveals EURUSD has mostly ranged over the last 20 sessions, rebounding sharply from 1.149 to 1.159 in the past two weeks but holding an overall sideways pattern. The 20-day MA is subtly climbing, while MACD remains elevated—momentum, however, appears to be stalling. Bollinger bands highlight a trading zone between 1.149 and 1.159. Two recent candlesticks show long upper wicks (signaling rejection of highs), reinforcing resistance and suggesting short-term downside risk.
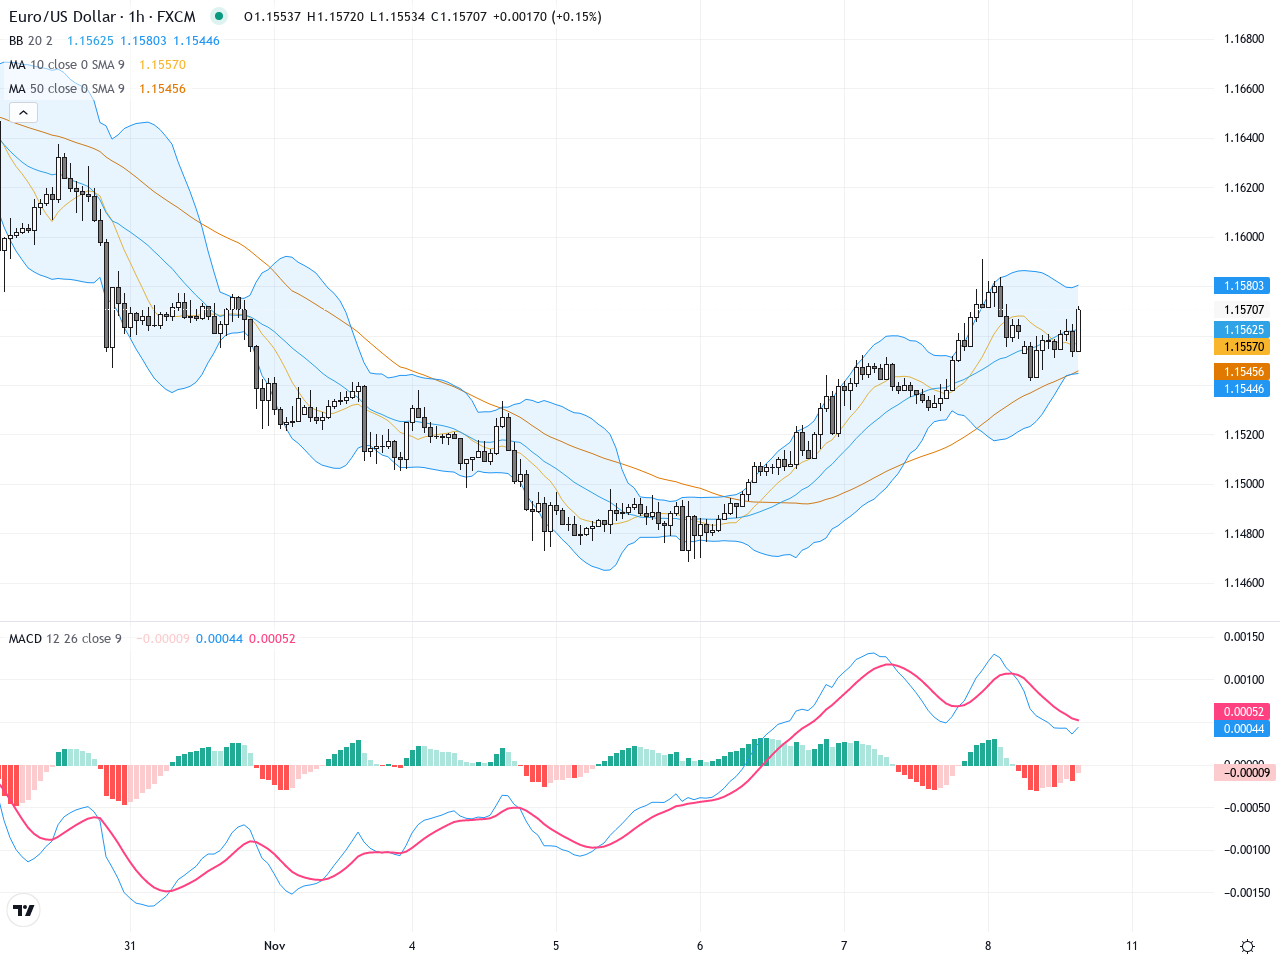
The hourly chart covering the last three days (~40 candles) shows initial consolidation at 1.155, then a rapid spike to 1.159 before intense profit-taking sent prices back toward 1.156. MACD has crossed bearish, and RSI dipped to 35—briefly signaling oversold conditions. The price action formed a clear inverted V, illustrating mounting sell pressure and the likelihood of a short-term test of support levels.
Technical Trend: Current direction: Volatile Sideways—momentum leans slightly bearish, with room for further downside.
This week’s key technical takeaway is the daily reversal candlesticks and MACD ‘stalling’ at highs, which signal possible profit-taking and short-term corrective pressure. Hourly RSI went oversold as sellers briefly dominated, but unless 1.155 fails, downside may be limited. Volume and price reactions to range boundaries will likely offer prime trade setups—watch for real or fake breakouts between 1.159 and 1.153.
Resistance & Support
https://1uptick.com/wp-content/uploads/2025/11/hourly-chart-ENrs2025-11-10T085116.2080100.png
<
p style=”padding: 10px; margin: 20px 0; border: solid 1px #fa003f; border-radius: 5px;”>The above financial market data, quotes, charts, statistics, exchange rates, news, research, analysis, buy or sell ratings, financial education, and other information are for reference only. Before making any trades based on this information, you should consult independent professional advice to verify pricing data or obtain more detailed market information. 1uptick.com should not be regarded as soliciting any subscriber or visitor to execute any trade. You are solely responsible for all of your own trading decisions.