


 |
| Gold V.1.3.1 signal Telegram Channel (English) |

GBPUSD: Triangle Squeeze Signals a Breakout—Sterling Approaches Make-or-Break Zone
2025-11-10 @ 16:45
GBPUSD: Triangle Squeeze Signals a Breakout—Sterling Approaches Make-or-Break Zone
Over the past three trading days, GBPUSD has whipped between 1.31 and 1.32, closing at 1.31789 on November 9, right at the upper edge of its recent range. With no major news headlines in the last week, all eyes are on upcoming UK and US CPI data, leaving investors in cautious mode. This week’s price indecision forms a classic technical squeeze—GBPUSD is coiling for a breakout. For the average market participant, this means sitting tight: momentum is building, and once the triangle pattern breaks, volatility will return in force. The current GBPUSD Price Analysis is a story of patience—watching for a confirmed push above resistance or a drop below support to unleash the next big move. Short-term traders benefit most by waiting for this crucial trigger and keeping stops tight in this high-volatility setup.
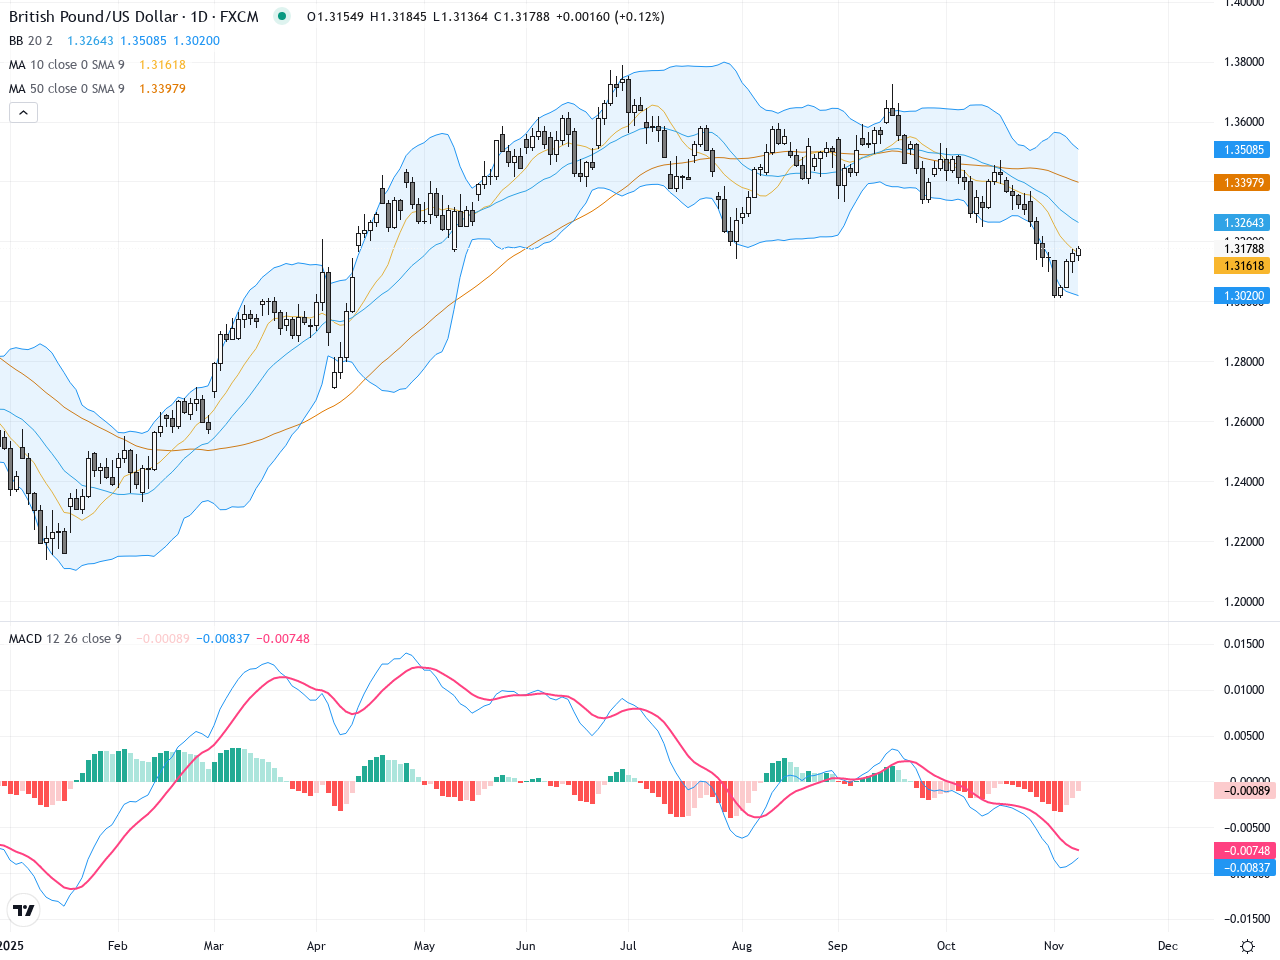
The daily chart shows GBPUSD forming a tight triangle over the past 10 sessions, with price bouncing between 1.315 and 1.32. Both the 50- and 200-day moving averages are capping from above, signaling a broader bearish bias. Bollinger Bands have contracted, warning of an imminent breakout. MACD is flat below zero, underpinning indecision but also primed for an explosive move. Technical focus is on the apex of this consolidation—when the breakout hits, it’s likely to run hard.
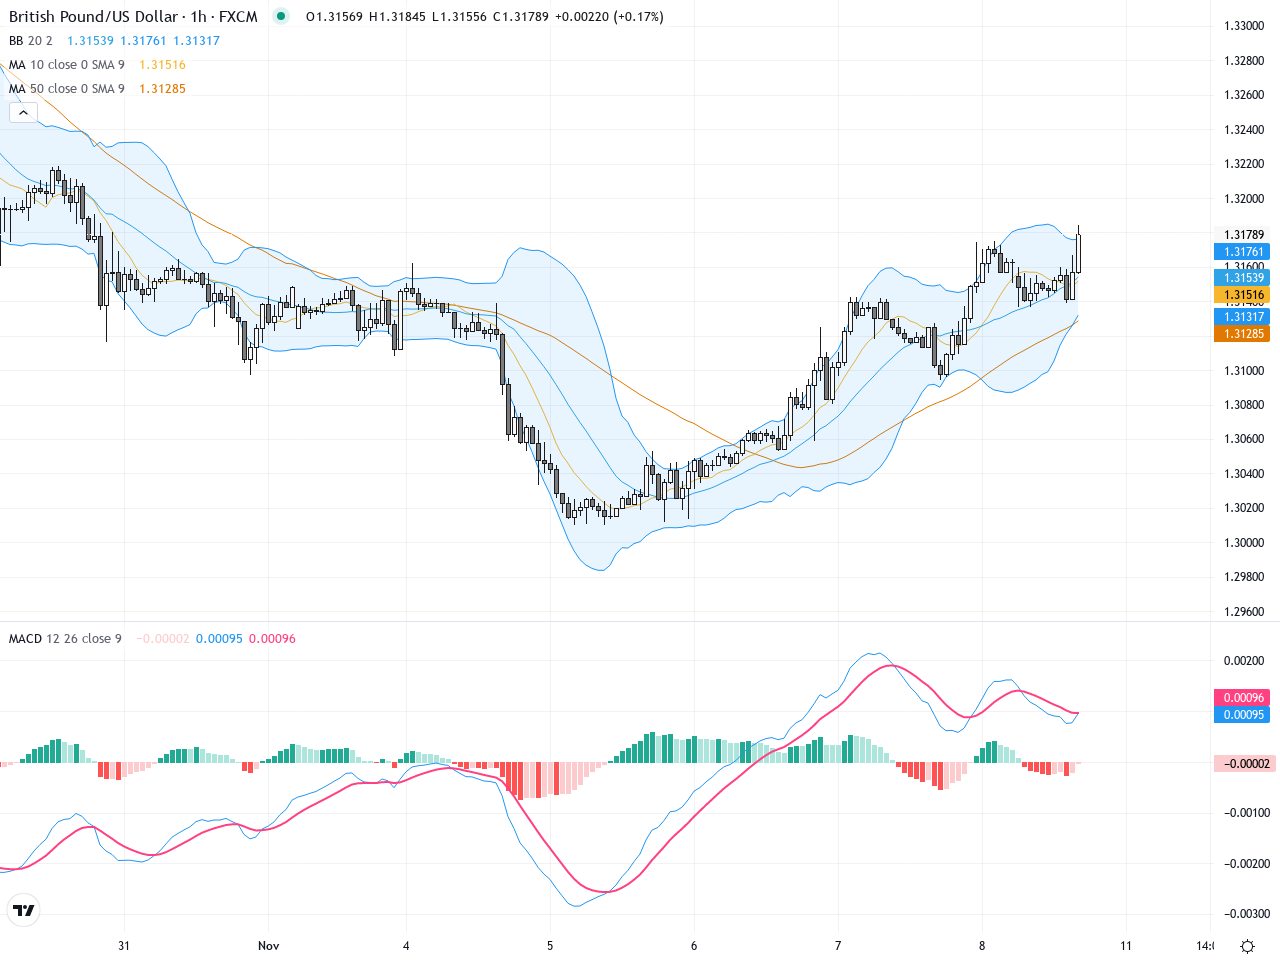
On the hourly chart, GBPUSD has spent the last 40 candles moving sideways after a brief push to 1.31845, now holding support at 1.31400. Frequent upper wicks signal stiff overhead resistance. Over the past 12 hours, a neat bull flag has emerged, with MACD lines flirting with a bullish cross above zero—momentum is tilting higher. The mid-Bollinger band acts as key resistance, and traders are watching for a break above 1.3190 or a quick dip below 1.313.
Technical Trend: Polarized consolidation—stuck in a high-sensitivity range; short-term tactical bullishness.
The dominating technical pattern is the daily triangle, guided by an emerging hourly bull flag. The standout candlestick pattern is the hourly ‘long upper wick’—which warns of persistent supply overhead and serves as a red flag for breakout chasers. In the next 24 hours, a confirmed move through the triangle boundary will unleash significant volatility: a close above resistance could power a 100-200 pip rally, while a drop below key support could invite sharp selling.
Resistance & Support
https://1uptick.com/wp-content/uploads/2025/11/hourly-chart-ENrs2025-11-10T094521.4050100.png
<
p style=”padding: 10px; margin: 20px 0; border: solid 1px #fa003f; border-radius: 5px;”>The above financial market data, quotes, charts, statistics, exchange rates, news, research, analysis, buy or sell ratings, financial education, and other information are for reference only. Before making any trades based on this information, you should consult independent professional advice to verify pricing data or obtain more detailed market information. 1uptick.com should not be regarded as soliciting any subscriber or visitor to execute any trade. You are solely responsible for all of your own trading decisions.