


 |
| Gold V.1.3.1 signal Telegram Channel (English) |
USDJPY: Approaching the 154 Level with Technical Patterns Indicating Short-Term Rebound Potential
2025-11-17 @ 15:41
USDJPY: Approaching the 154 Level with Technical Patterns Indicating Short-Term Rebound Potential
Over the past three trading days, USDJPY has fluctuated between 154.30 and 154.80, closing near 154.70 yesterday and showing a steady upward trend. Recent Q3 Japanese GDP data revealed a mild economic contraction, which increased expectations of short-term yen weakness, boosting the USDJPY price. For the average investor, this means the dollar currently holds an advantage over the yen, signaling a potential rebound. Technically, USDJPY is positioned between key support and resistance levels, awaiting a decisive breakout. Traders should closely monitor charts and critical price points. Overall, paying attention to economic data and price breakouts remains essential for strategic positioning.

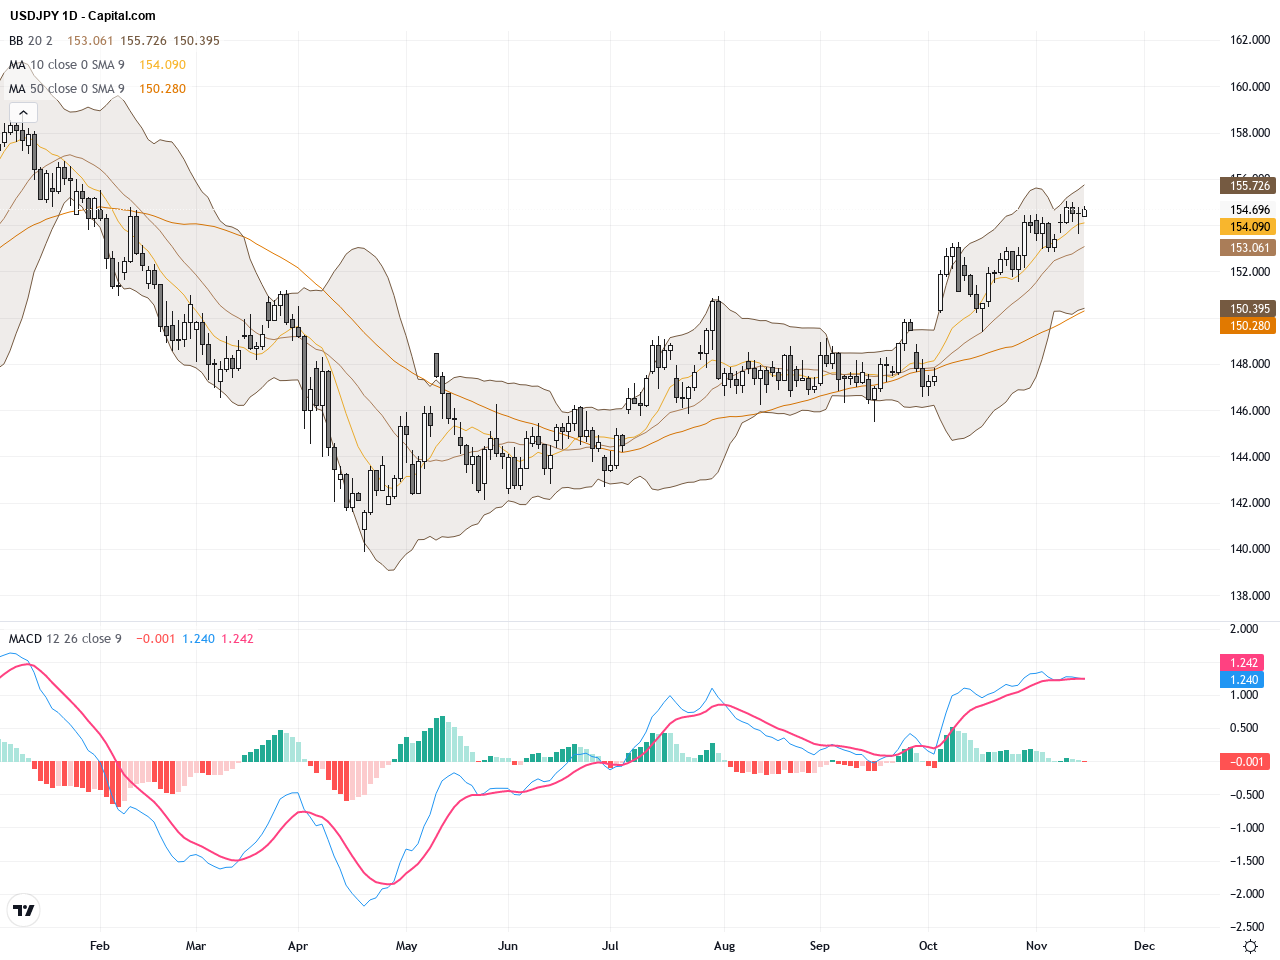
The daily chart shows USDJPY exhibiting a consolidating uptrend over the last 20 trading days, trading recently in the 154-155 range. The 20-day moving average is rising and positioned above both the 50-day and 200-day moving averages, indicating sustained bullish momentum short to medium term. Bollinger Bands are narrowing, suggesting impending higher volatility. The MACD is showing a bullish crossover with the signal line, implying strengthening momentum. Overall, the daily chart supports a technical base for a rebound near the 154 level.
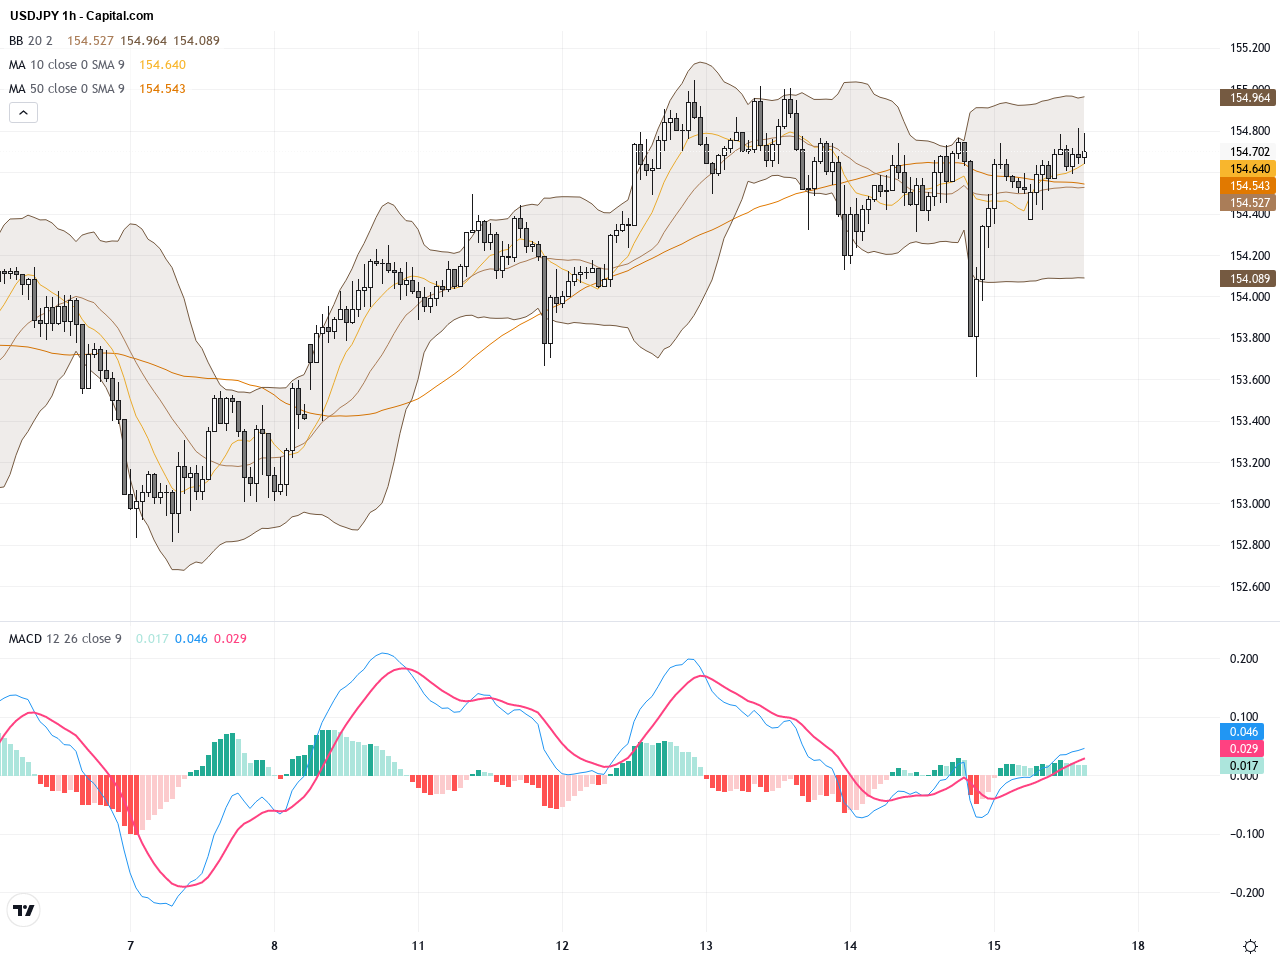
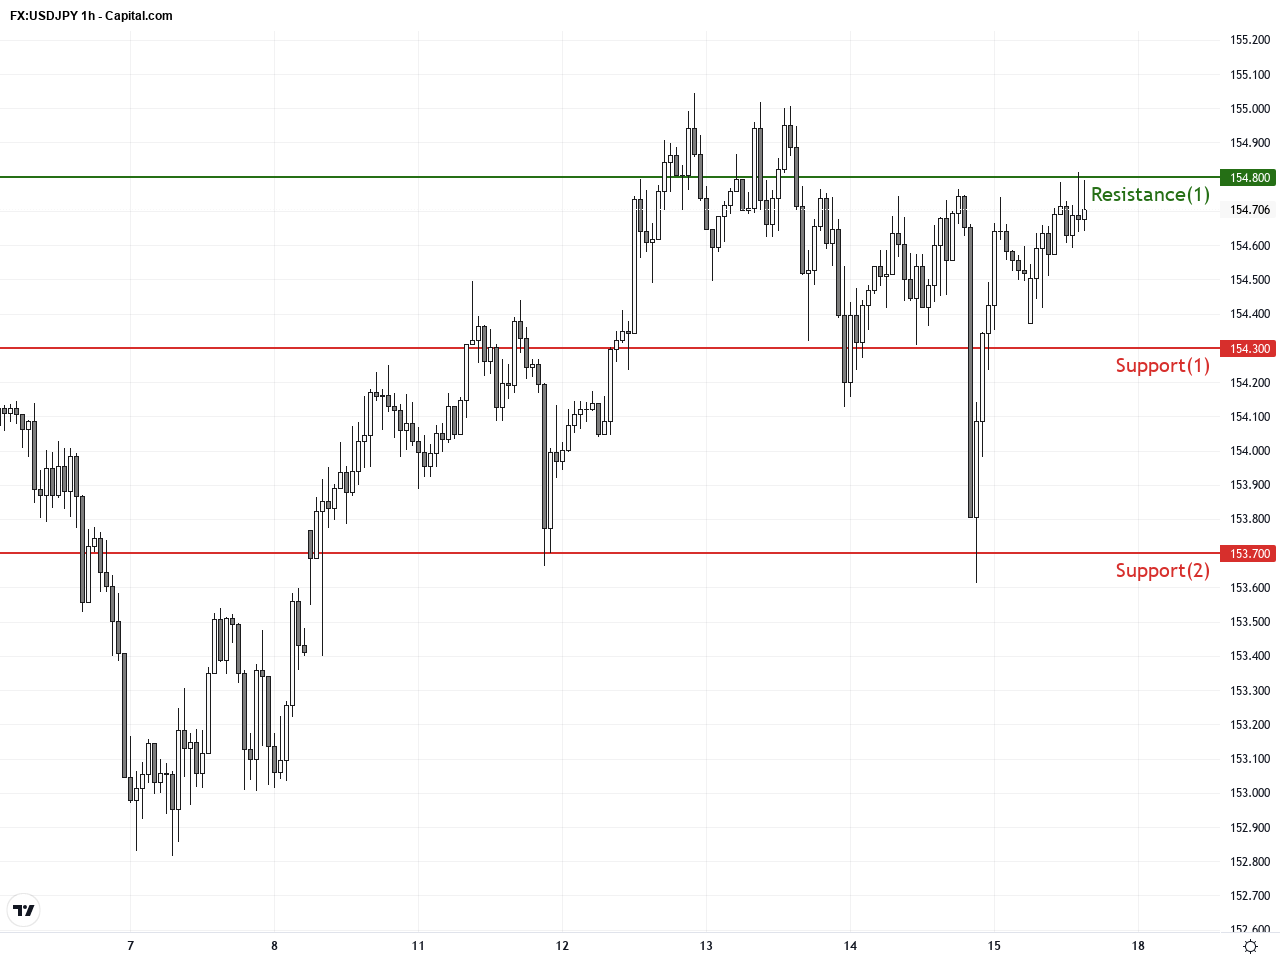
The hourly chart shows USDJPY trading in a narrow range approximately between 154.30 and 154.80 over the past 3-5 days. The 50 and 20-hour moving averages converge near 154.50, forming short-term support. Bollinger Band width remains tight, and MACD hovers near the zero line, indicating indecisive momentum. Notably, recent candlesticks exhibit a hammer pattern, signaling a potential reversal. A break above 154.80 could open the door for further upside, while a break below 154.30 might trigger renewed downside pressure.
Technical Trend: The current trend is cautiously bullish with a short-term range-bound upward bias, reflecting a steady but careful market sentiment.
Technically, the MACD bullish crossover on the daily chart alongside narrowing Bollinger Bands implies imminent increased volatility and potential breakout. The hammer candlestick on the hourly chart signals a buying interest emerging, supported by moving averages. The critical level to watch remains the 154.80 resistance for a valid breakout entry. Traders should be wary of false breakouts and confirm moves using volume and other momentum indicators for higher-probability trades.Today’s GMT+1 time zone economic data from Japan showed the Q3 preliminary GDP annualized decline at -1.8%, better than the forecasted -2.5%. Despite the contraction, this outcome reflects economic headwinds. Meanwhile, September’s industrial production increased by 2.6% month-over-month, surpassing expectations and showing some recovery signs. There are no additional significant or directly impactful events scheduled for USDJPY today. Overall, Japanese data suggests limited short-term support for the pair, but continued weakness could pressure the yen further, benefiting the dollar.
Resistance & Support
<
p style=”padding: 10px; margin: 20px 0; border: solid 1px #fa003f; border-radius: 5px;”>The above financial market data, quotes, charts, statistics, exchange rates, news, research, analysis, buy or sell ratings, financial education, and other information are for reference only. Before making any trades based on this information, you should consult independent professional advice to verify pricing data or obtain more detailed market information. 1uptick.com should not be regarded as soliciting any subscriber or visitor to execute any trade. You are solely responsible for all of your own trading decisions.