

 |
| Gold V.1.3.1 signal Telegram Channel (English) |

USDJPY: Ascending Flag Breakout Signals Trader Showdown Near 154.40
2025-11-10 @ 16:40
USDJPY: Ascending Flag Breakout Signals Trader Showdown Near 154.40
USDJPY has been surging in the past three sessions, closing at 153.989 yesterday (+0.4%), reflecting ongoing volatility and a tug-of-war at key resistance. No major headlines hit the tape, but traders remain hyper-sensitive to BOJ policy hints and the aftermath of the latest US jobs data. The lack of clear news leaves price action and technicals firmly in the spotlight. For the average investor, USDJPY is now at an inflection point: will the yen rebound on policy shifts or does the dollar keep the upper hand? With prices consolidating near highs and key technical levels under pressure, risk control is paramount—the next breakout could define the trend into year-end.
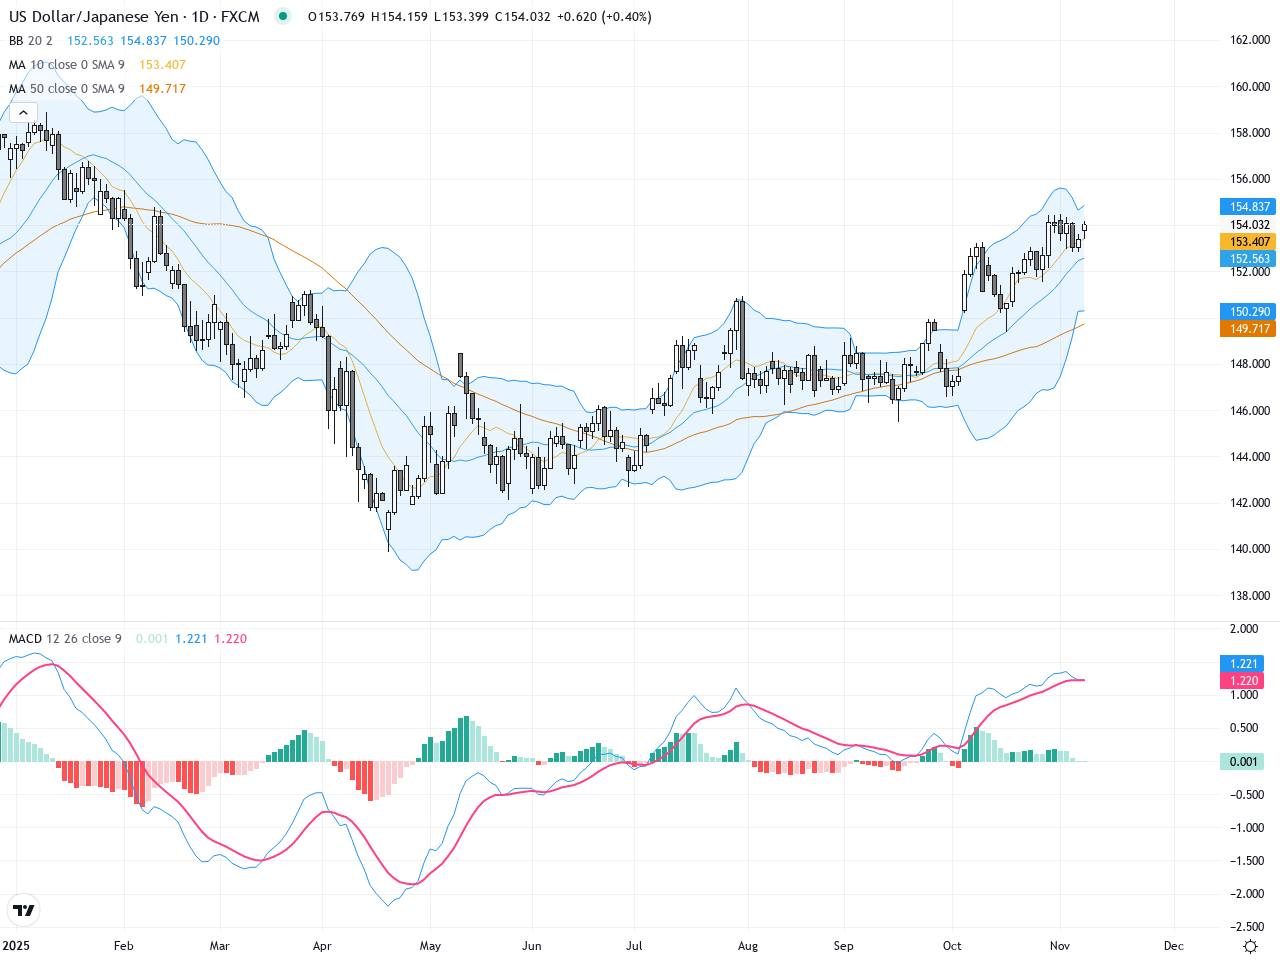
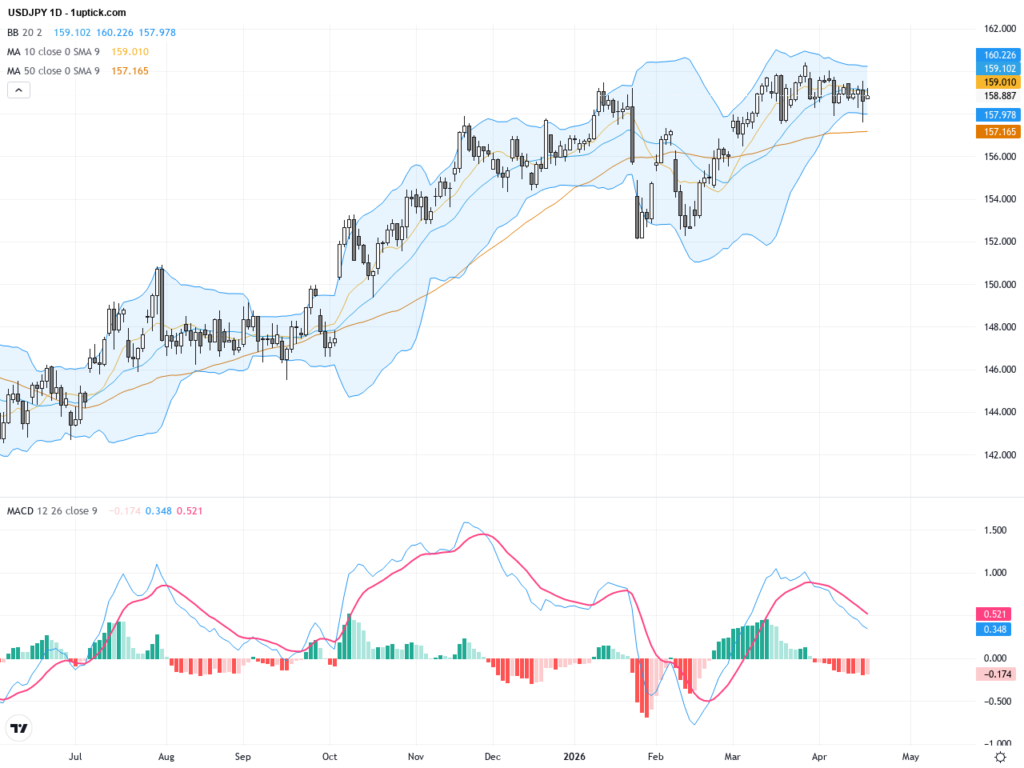
The daily chart shows a clear upward drift over the last 5-20 trading days. Major moving averages (like the MA20 and MA50) are sloping up, highlighting mid-term bullish momentum. A textbook ascending flag pattern is forming, suggesting bulls are gathering steam during this consolidation. Price flirting with 154.25 is critical; holding above this level would trigger the next wave higher. Bollinger Bands are widening, reinforcing the potential for imminent volatility. All eyes now on a volume-backed breakout to retest annual highs.
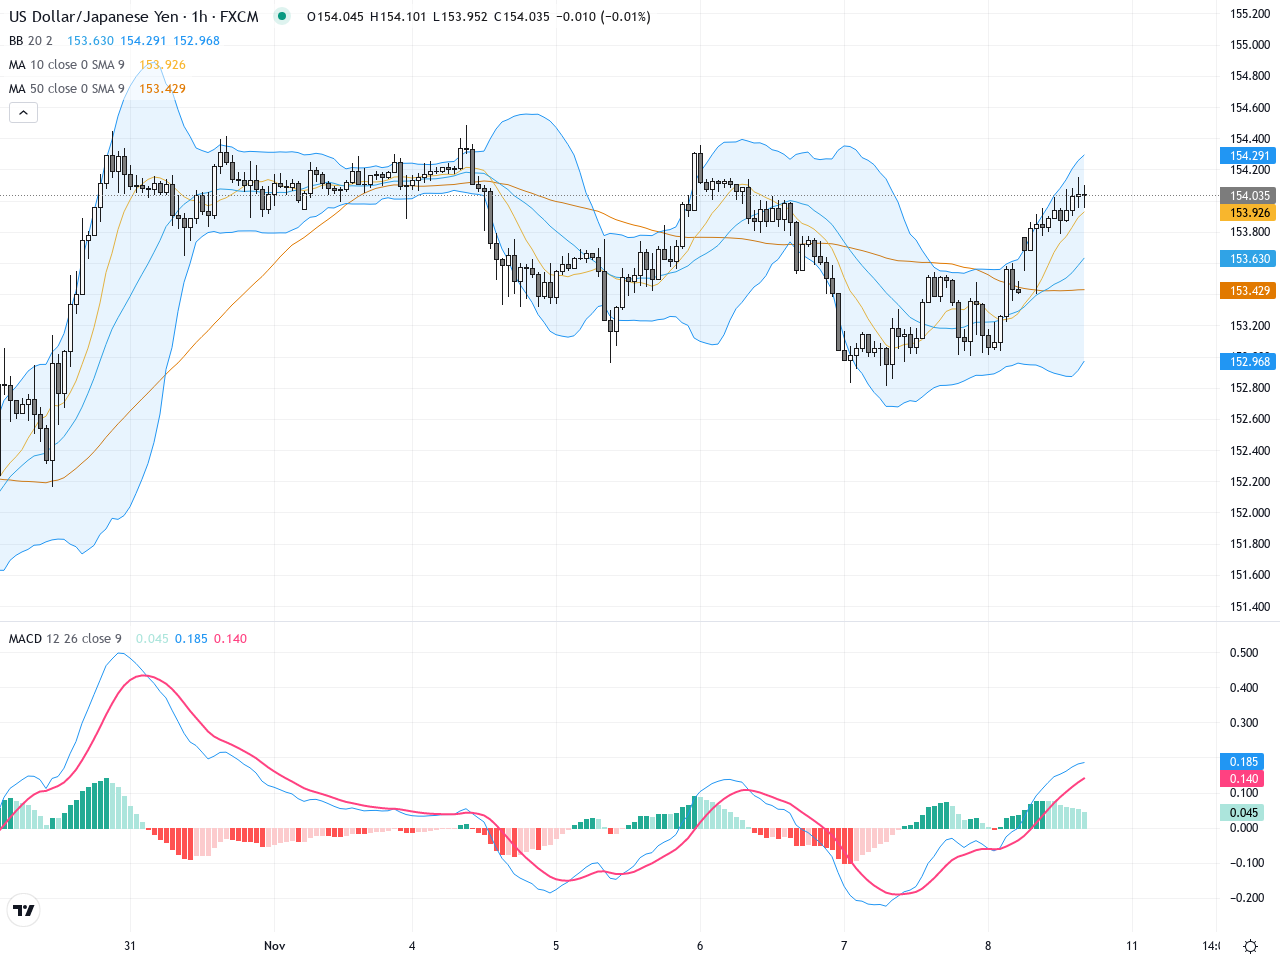
On the 4-hour and 1-hour charts, USDJPY has seen rising volatility over the past 3-5 days, crystallizing into an ‘ascending triangle’ pattern. MACD lines have just crossed bullishly, and the latest hourly candle shows a solid green bar—momentum is heating up. Immediate support is at 153.60, with resistance at 154.40—clearing this barrier could spark rapid upside within the next 24 hours as buyers pile in.
Technical Trend: Assertively Bullish with Upward Momentum
Technically, the daily flag and intraday triangle are converging, both hinting at brewing bullish strength. Yesterday’s candlestick was a classic bullish engulfing, suggesting fresh inflows. The MACD’s shift to positive further boosts upside odds. Watch 154.40 as the battle line—breakout targets new cycle highs; failure to hold 153.60 means range-bound trading may persist.
Resistance & Support
https://1uptick.com/wp-content/uploads/2025/11/hourly-chart-ENrs2025-11-10T093400.2600100.png
<
p style=”padding: 10px; margin: 20px 0; border: solid 1px #fa003f; border-radius: 5px;”>The above financial market data, quotes, charts, statistics, exchange rates, news, research, analysis, buy or sell ratings, financial education, and other information are for reference only. Before making any trades based on this information, you should consult independent professional advice to verify pricing data or obtain more detailed market information. 1uptick.com should not be regarded as soliciting any subscriber or visitor to execute any trade. You are solely responsible for all of your own trading decisions.