


 |
| Gold V.1.3.1 signal Telegram Channel (English) |

USDJPY: Key Resistance Builds Pressure Amid Sideways Consolidation, Short-Term Pullback Possible
2025-11-15 @ 21:41
USDJPY: Key Resistance Builds Pressure Amid Sideways Consolidation, Short-Term Pullback Possible
Over the past three trading days, USDJPY has oscillated within a narrow range between 154.3 and 154.7, closing at 154.723 yesterday. The currency pair remains strong but is struggling to break out decisively. With no major market news driving the price this week, the mild upward move stems mainly from persistent USD demand. Poor Chinese economic data coupled with ongoing yen weakness has led investors to adopt a cautious trading stance. For average investors, USDJPY is currently revisiting its support and resistance levels, suggesting a continuation of sideways consolidation in the short term. Close monitoring of technical signals is essential for upcoming trading decisions.
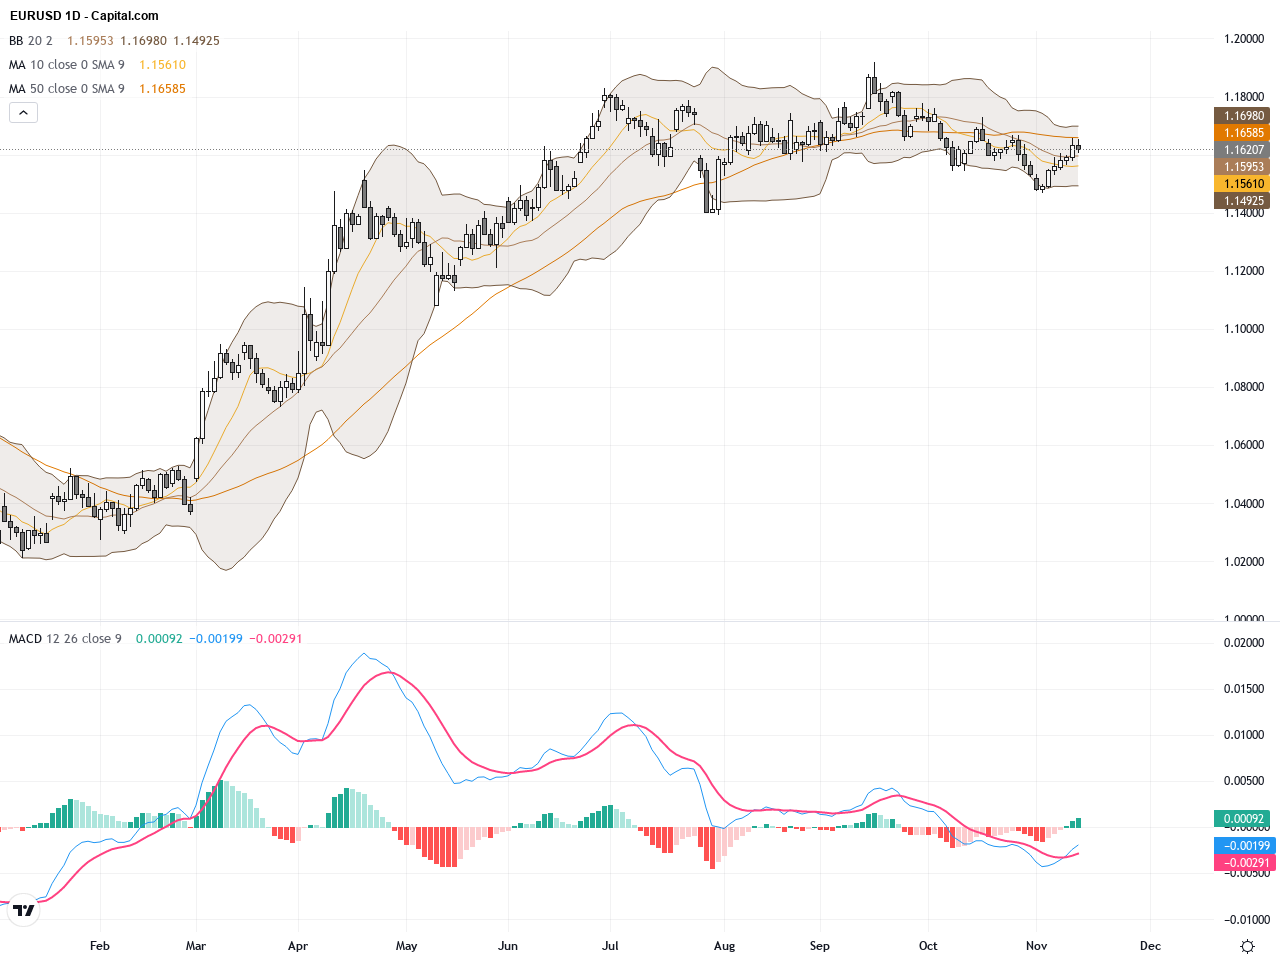
The daily chart shows USDJPY trending upward over the past 10 trading days, firmly trading above the 150-day moving average (~147.8) and the 50-day moving average (~150.5), confirming a longer-term bullish trend. The Bollinger Bands have tightened recently, indicating decreasing volatility and a potential upcoming price breakout. The MACD histogram is showing a slight positive expansion, suggesting room for further upside momentum, though no decisive breakout is visible yet. Overall, the daily trend remains bullish but cautious.
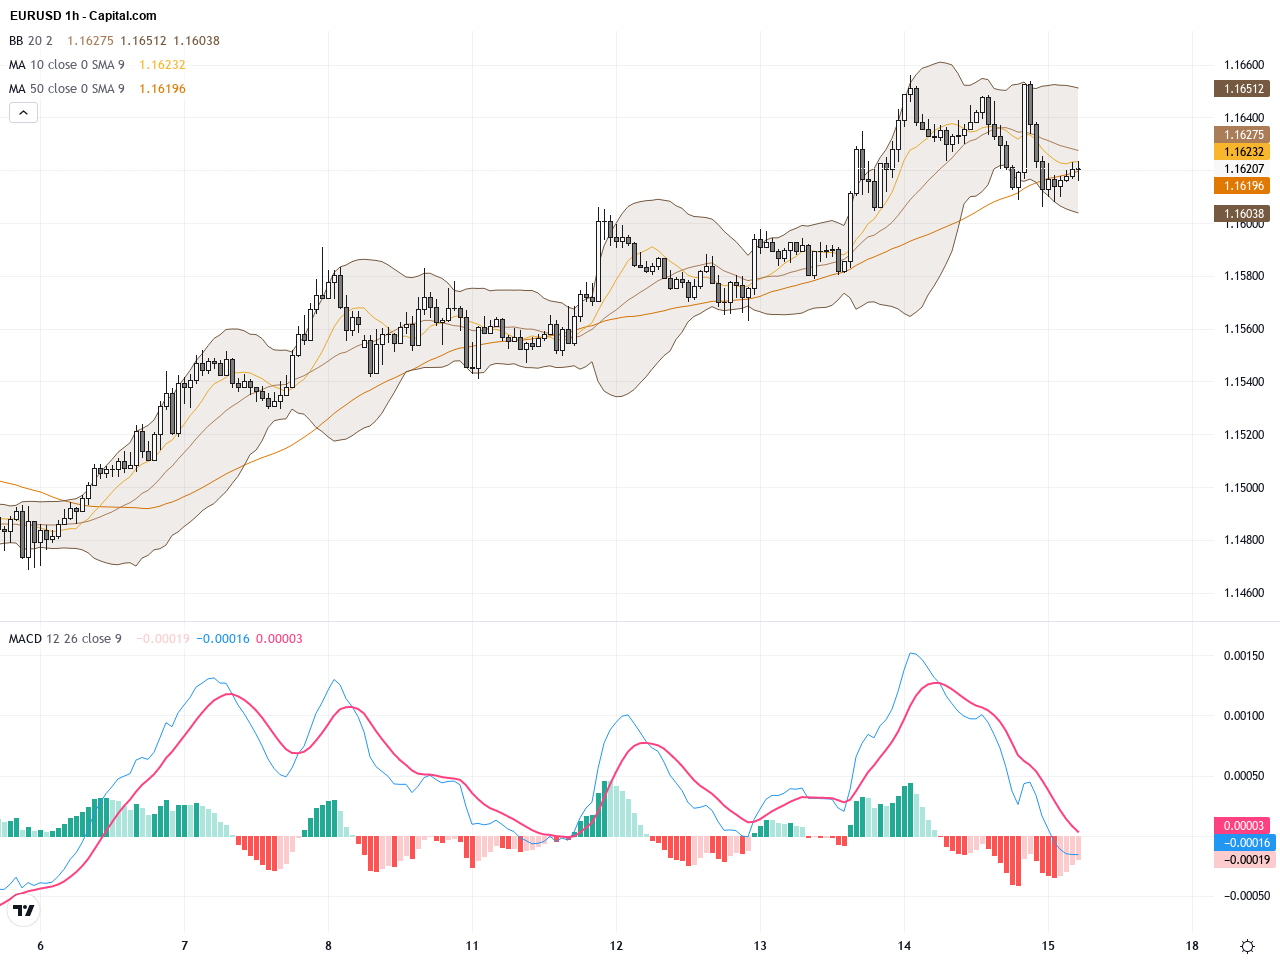
On the hourly chart covering the last 5 days, USDJPY exhibits a clear sideways pattern between 154.2 and 154.8. Short-term moving averages are intertwined, and repeated tests of the 154.7 resistance level failed to yield a breakout, forming a rectangle consolidation pattern. The MACD lines have crossed multiple times, reflecting balanced buying and selling pressures. A recent bearish engulfing candlestick pattern indicates strengthening selling pressure that may lead to a short-term pullback toward the 154.3 support. The short-term outlook remains range-bound.
Technical Trend: USDJPY currently exhibits cautious sideways consolidation, showing a moderately bullish overall trend but with increased short-term volatility.
Key technical insights revolve around the daily Bollinger Band squeeze and expanding MACD histogram, potentially signaling an upcoming directional move. The hourly bearish engulfing candle suggests short-term selling pressure, although the broader daily trend remains bullish. Traders should watch USDJPY’s reaction near the 154.7 resistance and 154.3 support levels closely, as a breakout from this range could trigger significant momentum. Volume confirmation is still necessary to validate any sustained trend shift.Today’s economic calendar focuses mainly on European and Chinese data, with no major US figures directly affecting USDJPY. Chinese industrial production and housing investment underperformed expectations, highlighting continued economic headwinds that support yen weakness indirectly. The US has no significant economic releases today, with only FOMC members’ speeches on the agenda, leading to limited volatility. Overall, no significant events are expected to cause sharp moves in USDJPY today, leaving technical and flow factors as primary drivers.
Resistance & Support

<
p style=”padding: 10px; margin: 20px 0; border: solid 1px #fa003f; border-radius: 5px;”>The above financial market data, quotes, charts, statistics, exchange rates, news, research, analysis, buy or sell ratings, financial education, and other information are for reference only. Before making any trades based on this information, you should consult independent professional advice to verify pricing data or obtain more detailed market information. 1uptick.com should not be regarded as soliciting any subscriber or visitor to execute any trade. You are solely responsible for all of your own trading decisions.