

 |
| Gold V.1.3.1 signal Telegram Channel (English) |

AUDUSD: Consolidation Around 0.6550 with Strong Australian Economic Data in Focus
2025-12-03 @ 08:01
The Australian Dollar to US Dollar (AUD/USD) extended its bullish momentum over the past 24-48 hours, trading within the 0.6550-0.6575 range. As of December 2, AUD/USD rose to 0.6561, up 0.27% from the previous session and slightly lower than yesterday’s closing price of 0.6573. This rally was driven by three primary factors. First, Australia’s third-quarter GDP data came in stronger than expected, demonstrating solid economic momentum and supporting demand for the Australian Dollar. Second, Australian inflation data shifted to a more optimistic outlook, reshaping market expectations for further rate cuts from the Reserve Bank of Australia and suggesting limited scope for additional easing. Third, the US Dollar faced seasonal December weakness, as the month traditionally presents headwinds for the greenback, especially amid signals of Federal Reserve accommodation—prompting investors to pivot toward risk assets, with the Aussie benefiting as a yield-supported currency. Technically, AUD/USD has broken above the psychological 0.6500 level and is challenging the December peak at 0.6566, with a breakout potentially testing the November high of 0.6580. However, disappointing Chinese PMI data continues to weigh on commodity prices, constraining further upside for the Australian Dollar. Markets expect the pair to oscillate within the 0.6515-0.6585 range in the near term, with sustained momentum requiring confirmation above 0.6585 to avoid a pullback toward the 0.6370 support level.
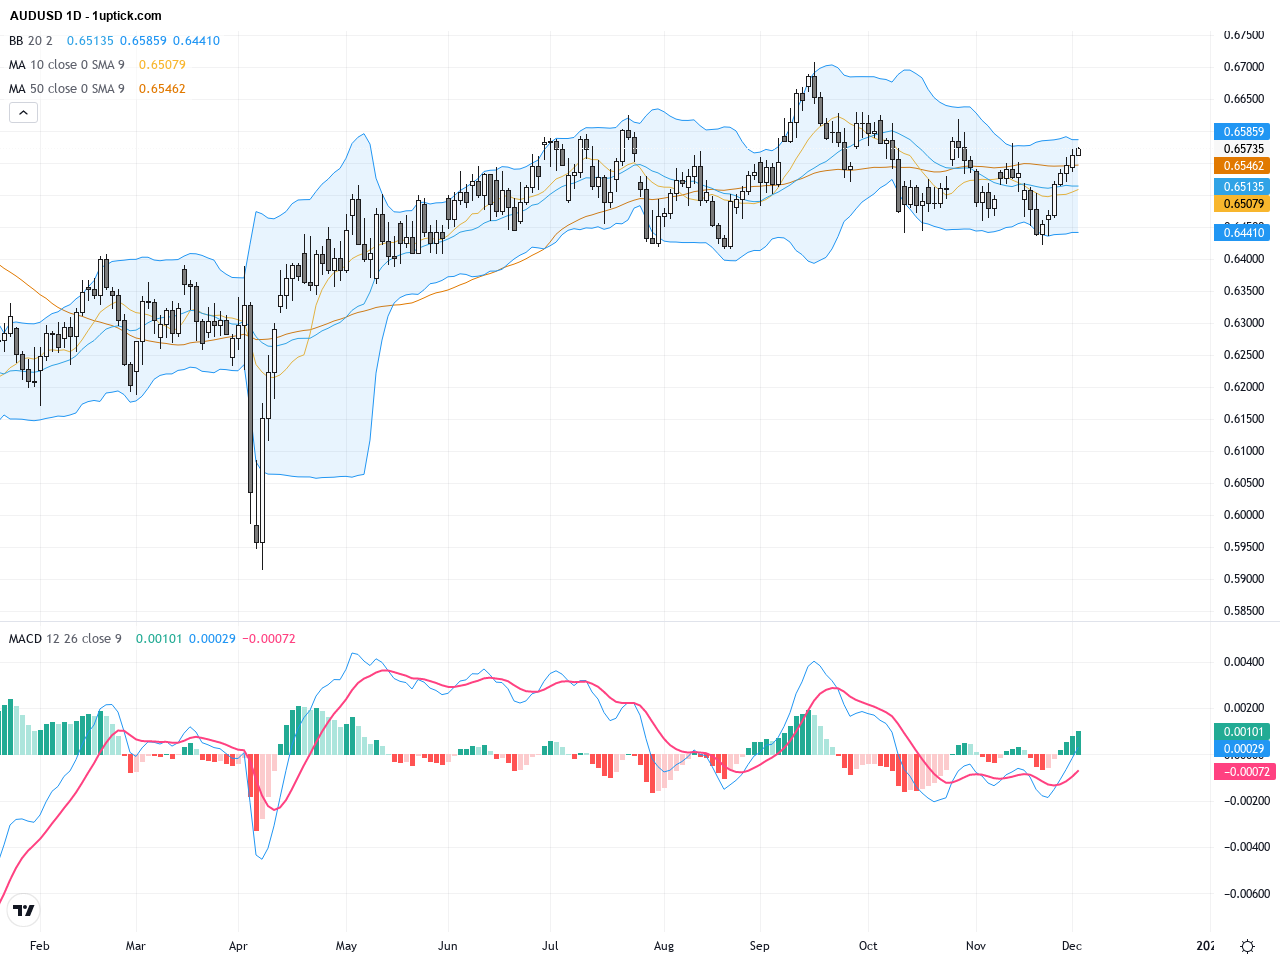
The daily chart reveals a steady uptrend over the past month with AUDUSD consistently holding above its 200-day moving average near 0.6508. Moving averages are in a bullish alignment with shorter-term moving averages crossing above the longer-term MA, indicating sustained bullish momentum. The Bollinger Bands are narrowing, showing reduced volatility, with prices currently near the middle band implying consolidation. The MACD remains above zero but momentum is flattening, suggesting potential pause or small retracement before continuation.
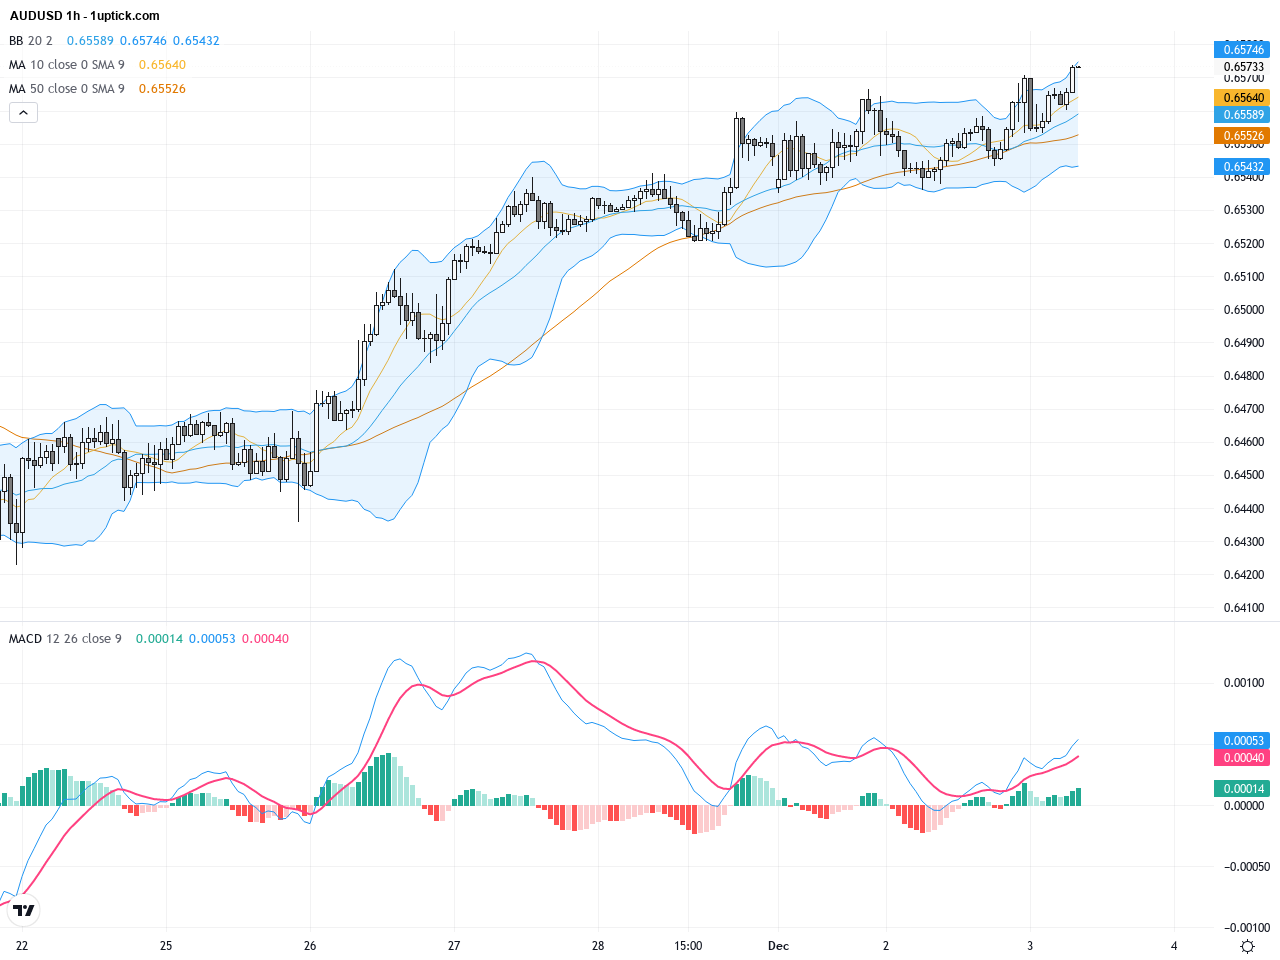
On the hourly chart, AUDUSD has traded sideways over the last 3-5 days within 0.6520-0.6580 range. Moving averages (20 and 50) are intertwined indicating indecisiveness in short-term price direction. Bollinger Bands are contracting awaiting a breakout, while MACD lines are converging with no clear cross, showing no strong momentum for either side currently. Traders should watch for decisive price moves beyond these tight ranges for trading opportunities.
Technical Trend: Cautiously Consolidating
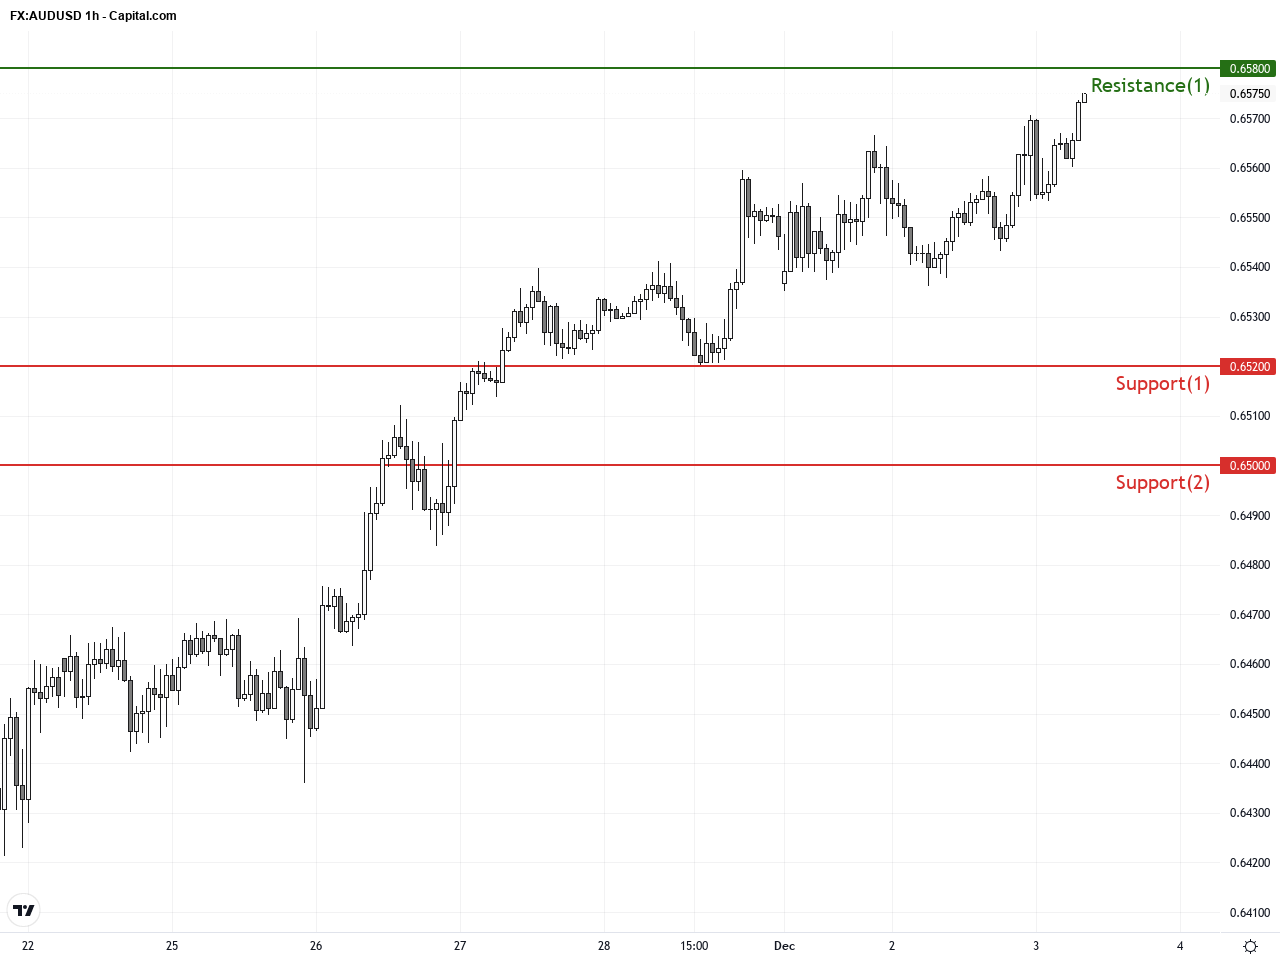
Technically, AUDUSD is currently forming a rectangular consolidation pattern between 0.6520 and 0.6580, persisting for several days accompanied by diminishing volume and narrowing Bollinger Bands, reflecting market indecision. The daily chart’s bullish moving averages and MACD indicate medium-term upside bias, while the hourly chart’s mixed signals suggest short-term momentum is lacking. The latest notable candlestick is a doji with shadows, signaling equilibrium between buyers and sellers and likely continuation of sideways price action until a breakout occurs. Traders should pay attention to the upcoming Australian GDP release and breakout confirmation for a higher probability trade setup.Today’s key economic data impacting AUDUSD will center around Australia’s Q3 GDP release at 01:30 GMT+1 (09:30 HKT), with forecasts expecting 0.7% quarter-over-quarter and 2.2% year-over-year growth, which can bolster the Australian dollar if confirmed. Additionally, U.S. ADP employment and export prices later today may affect USD strength, indirectly influencing AUDUSD. Market participants should closely monitor these releases, particularly the Australian GDP, to gauge near-term directional cues for AUDUSD.
Resistance & Support
<
p style=”padding: 10px; margin: 20px 0; border: solid 1px #fa003f; border-radius: 5px;”>The above financial market data, quotes, charts, statistics, exchange rates, news, research, analysis, buy or sell ratings, financial education, and other information are for reference only. Before making any trades based on this information, you should consult independent professional advice to verify pricing data or obtain more detailed market information. 1uptick.com should not be regarded as soliciting any subscriber or visitor to execute any trade. You are solely responsible for all of your own trading decisions.