


 |
| Gold V.1.3.1 signal Telegram Channel (English) |
USDCAD: Key Technical Pattern Signals Intense Battle Between Bulls and Bears
2025-12-04 @ 08:02
Over the past 24 to 48 hours, the USD/CAD exchange rate experienced notable volatility, with prices dipping slightly from yesterday’s close around 1.39535 to hover near 1.3949. This movement was primarily driven by growing market expectations of upcoming Federal Reserve rate cuts amid weakening US economic data that undermined the dollar. Simultaneously, a rebound in oil prices boosted the Canadian dollar, increasing downward pressure on USD/CAD. Recent market news highlight that November was marked by uncertainty due to the US government shutdown, leaving traders cautious and the USD/CAD direction unclear. Additionally, comments from Trump regarding the Fed Chair triggered a sell-off in the US dollar, while weaker-than-expected US retail sales data intensified bets on Fed easing. Meanwhile, Canada’s economic outlook remained supported, particularly by recovering oil prices, which provided positive momentum for the Loonie. These factors combined to weigh on USD/CAD in recent days, holding it near the key support around 1.3940. For the average investor, this can be likened to holding two currencies—US dollars and Canadian dollars—when uncertainties around the US economy increase, the dollar tends to weaken, while Canada’s energy price recovery reinforces the Canadian dollar’s strength around it. Investors should watch upcoming US employment and service PMI data closely, as these will be pivotal in shaping the next phase of dollar movement against the Canadian dollar.

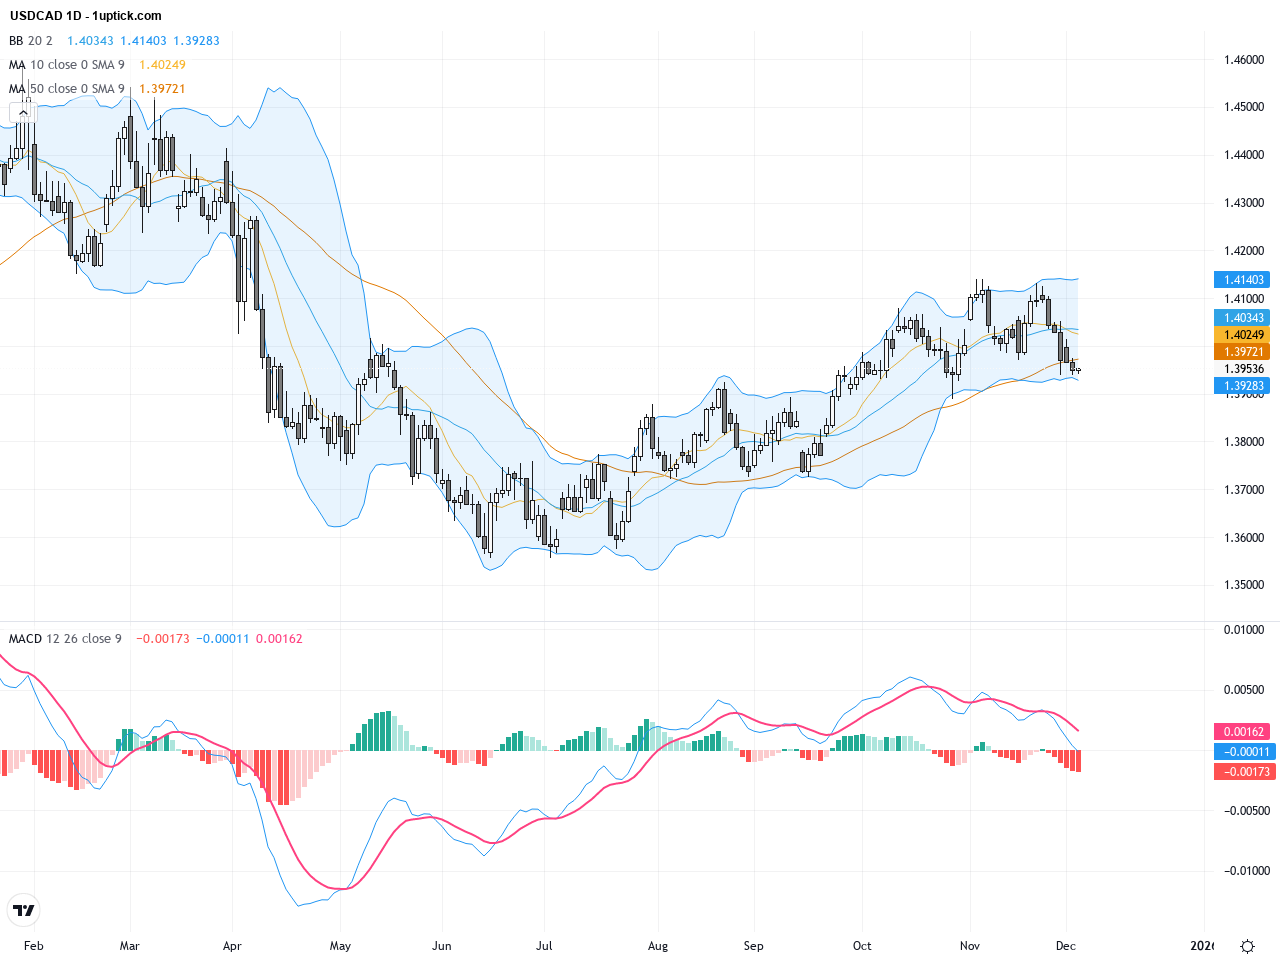
The daily chart shows USDCAD consolidating between 1.38 and 1.41, forming a sideways trend. The 50-day moving average is at 1.40253 and the 200-day at 1.38431, with the current price hovering close to the 200-day support. Bollinger Bands have narrowed indicating reduced volatility. MACD exhibits a mild bearish divergence, suggesting possible short-term corrective pressure. Overall, the long-term trend remains unclear with the market at a critical juncture.
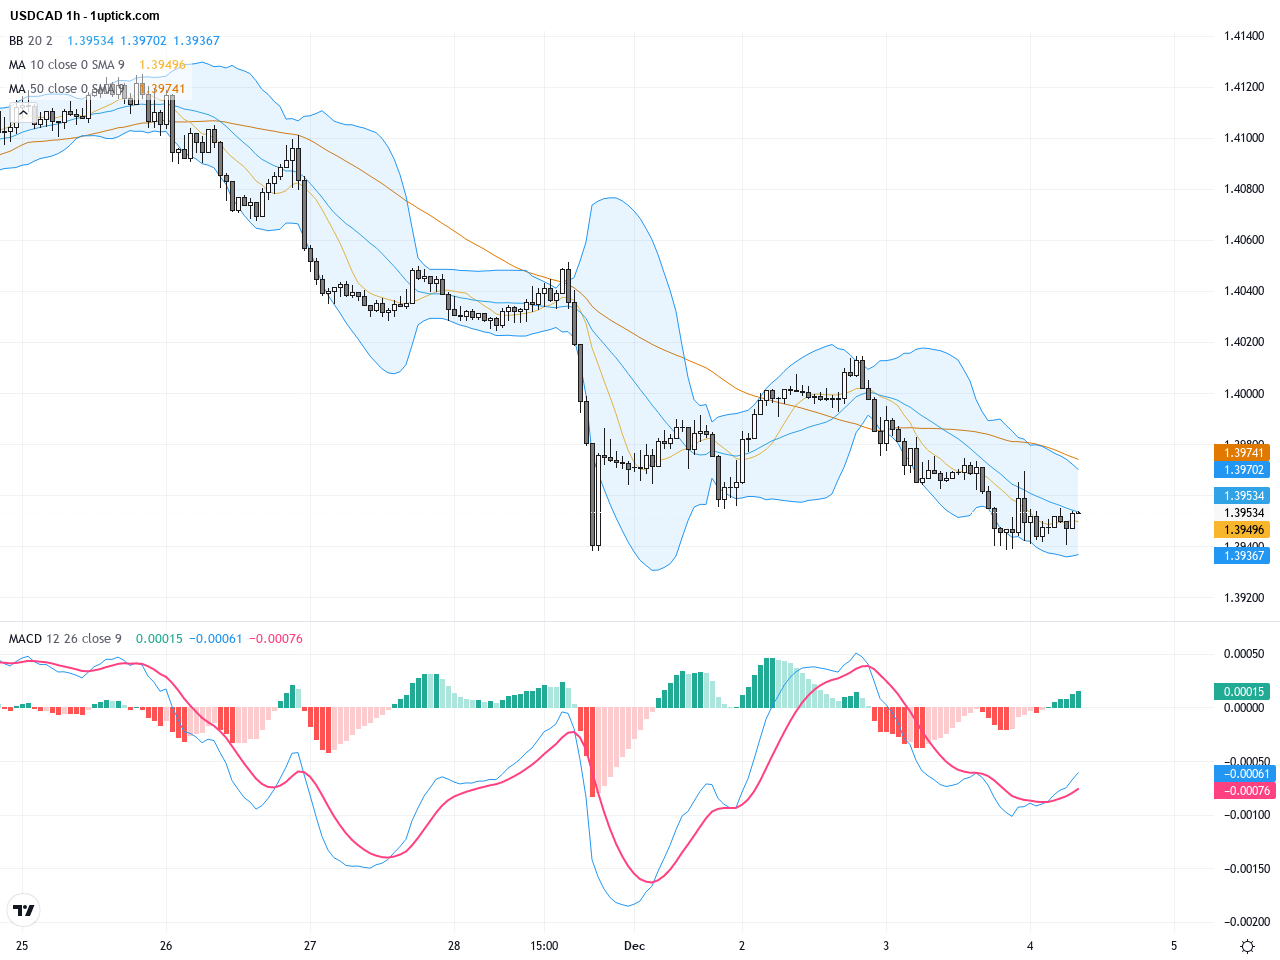
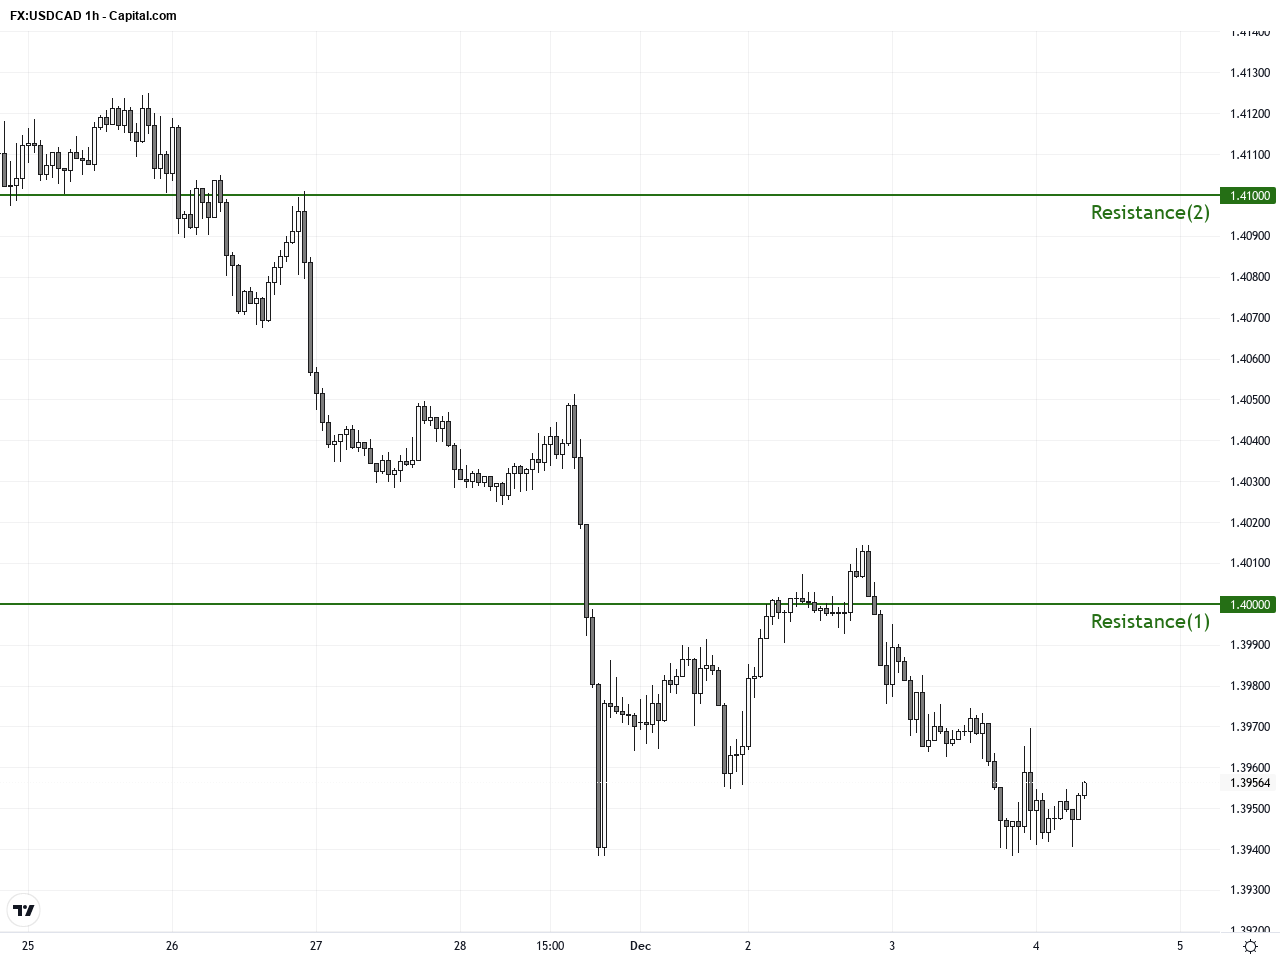
The hourly chart over the last 3-5 days reveals USDCAD experienced a local dip but found short-term support near 1.394, attempting to rally above 1.400 resistance. Short-term moving averages (20 and 50) converge at around 1.395, Bollinger Bands show price near the mid-band, and MACD histogram is turning positive, signaling potential momentum return. A recent bullish engulfing candlestick pattern suggests buying interest may prevail in the next 24 hours, possibly pushing prices higher.
Technical Trend: The current trend for USDCAD is cautiously consolidating, with bulls and bears fiercely contesting control around key levels, and the market awaiting a decisive breakout.
Technically, USDCAD is sitting near a critical support zone with a potential triangle consolidation pattern starting to form on the daily chart, signaling a pending breakout. MACD crossing above zero and RSI momentum shifts will be key indicators for the next directional move. The recent bullish engulfing candle denotes buyer interest; a break above 1.400 could trigger stronger bullish momentum, while a drop below the 200-day moving average could accelerate bearish trends.Today’s economic calendar highlights Canadian Labour Productivity data at 14:30 GMT+1, showing a rebound from -1% to 0.9%, providing some support for CAD. US ADP employment data released at the same time came in much weaker at -32K versus a forecast of +5K, which dampens USD strength. Additionally, the US ISM Non-Manufacturing Index at 16:00 exceeded expectations at 52.6. Overall, softer US employment data places pressure on USD, while improving Canadian data offers slight support; this dynamic is expected to keep USDCAD under some downside pressure.
Resistance & Support
<
p style=”padding: 10px; margin: 20px 0; border: solid 1px #fa003f; border-radius: 5px;”>The above financial market data, quotes, charts, statistics, exchange rates, news, research, analysis, buy or sell ratings, financial education, and other information are for reference only. Before making any trades based on this information, you should consult independent professional advice to verify pricing data or obtain more detailed market information. 1uptick.com should not be regarded as soliciting any subscriber or visitor to execute any trade. You are solely responsible for all of your own trading decisions.