


 |
| Gold V.1.3.1 signal Telegram Channel (English) |

WTI Crude Oil: Navigating Key Resistance Ahead – Trading Outlook and Technical Patterns
2025-12-04 @ 08:02
Over the past 24 to 48 hours, WTI crude oil prices have traded in a narrow range around $59 per barrel, closing at $59.01 on Wednesday, up 0.66% from the previous day. Oil prices found support amid a weaker US dollar and rising geopolitical risks, but gains were capped by an unexpected increase in US crude oil inventories. The latest news indicates that US-Russia talks on Ukraine have failed to reach a breakthrough, meaning restrictions on Russian energy exports will remain in place, further fueling market concerns over supply disruptions. At the same time, the US dollar index fell to a five-week low, making dollar-denominated commodities more attractive and boosting oil prices. However, the latest EIA report showed an unexpected rise in crude oil inventories, with gasoline and distillate supplies also exceeding expectations, putting pressure on oil prices and limiting gains. Overall, recent price action reflects the tug-of-war between geopolitical risks and supply-side data, and investors should closely monitor further developments in negotiations and inventory changes.
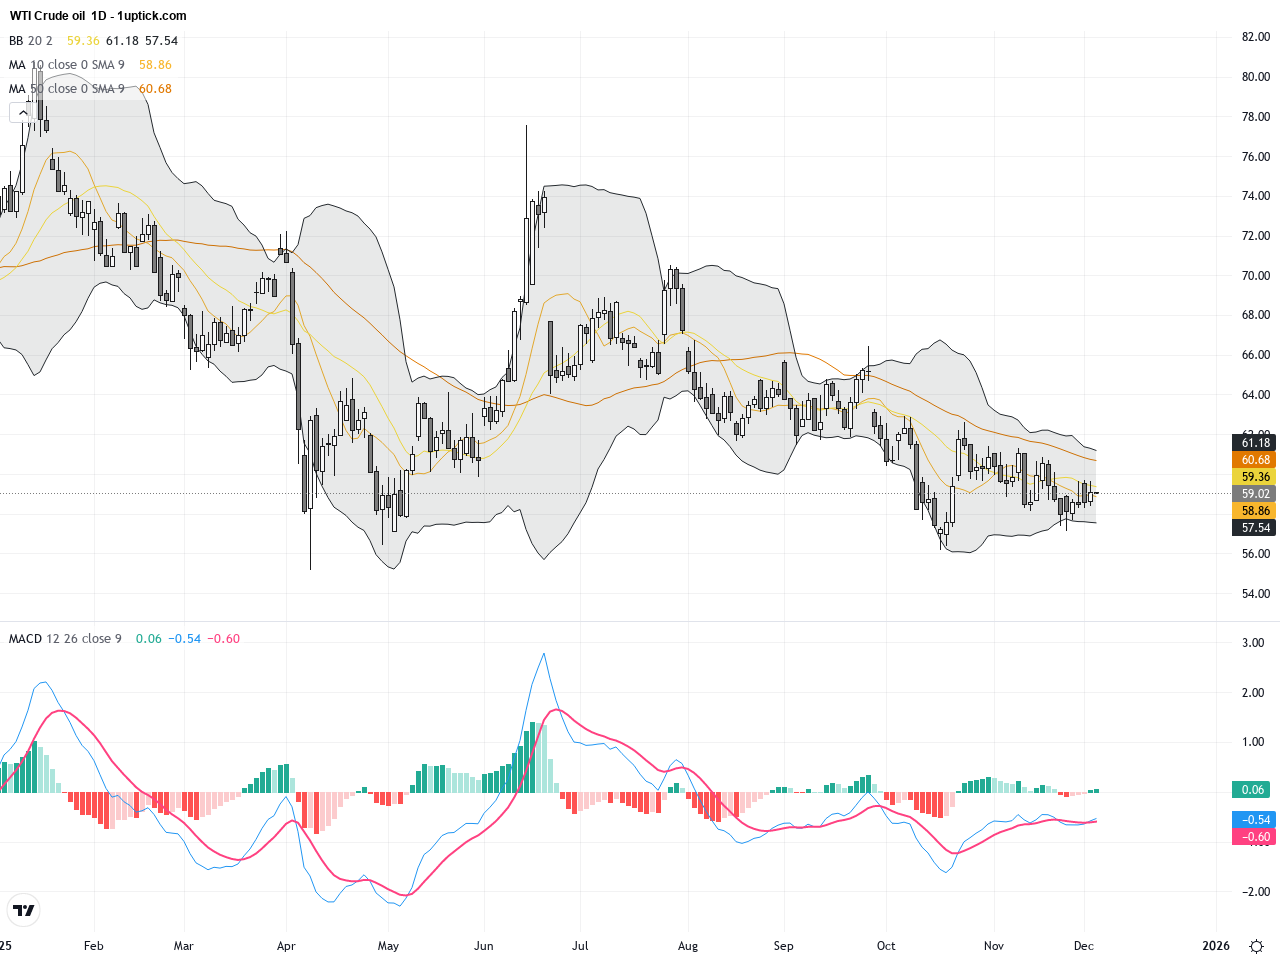
The daily chart shows a mild upward trend for WTI crude oil prices, hovering near key moving averages (MA50 and MA200). Price is consolidating around the $59 mark, with Bollinger Bands indicating a contraction in volatility. The MACD remains bullish signaling sustained long-term upward momentum. Overall, the technical structure suggests the market is at a critical decision point where a breakout or pullback could soon follow.
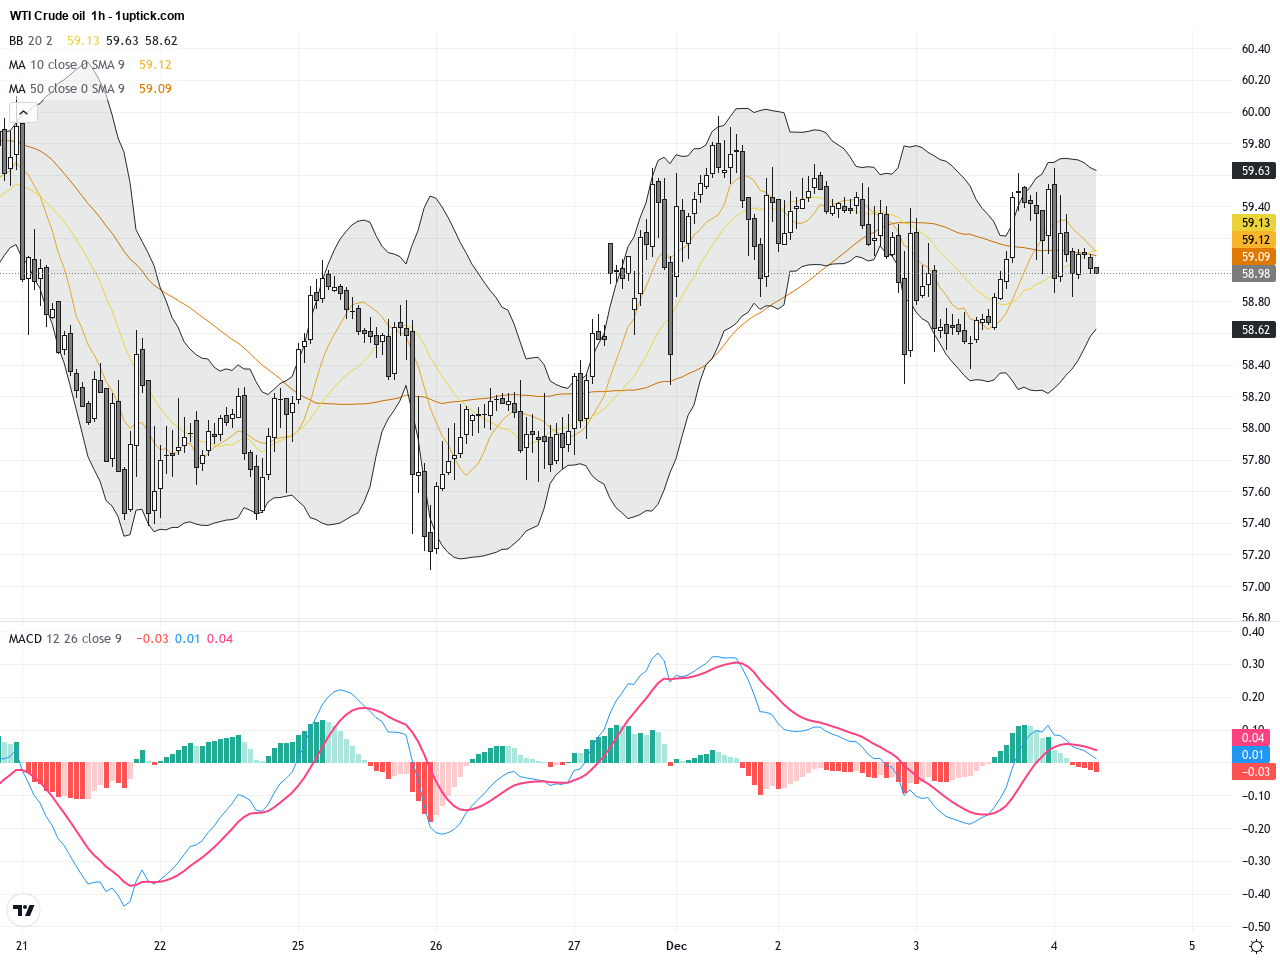
The hourly chart covering the past 3-5 days illustrates a classic flag consolidation pattern that started forming around November 30. The short-term MA20 is slightly rising, forming a golden cross with MA50, indicating strengthening short-term bullish momentum. Bollinger Bands are tightening, suggesting an imminent breakout, while the MACD histogram is contracting, showing momentum adjustment. The latest candlestick forms a bullish engulfing pattern indicating potential significant price movement in the next 24 hours.
Technical Trend: WTI Crude Oil currently shows a cautiously bullish trend, with prices gradually pushing higher within a volatile range but without a confirmed strong breakout, reflecting a market in delicate balance between buyers and sellers.
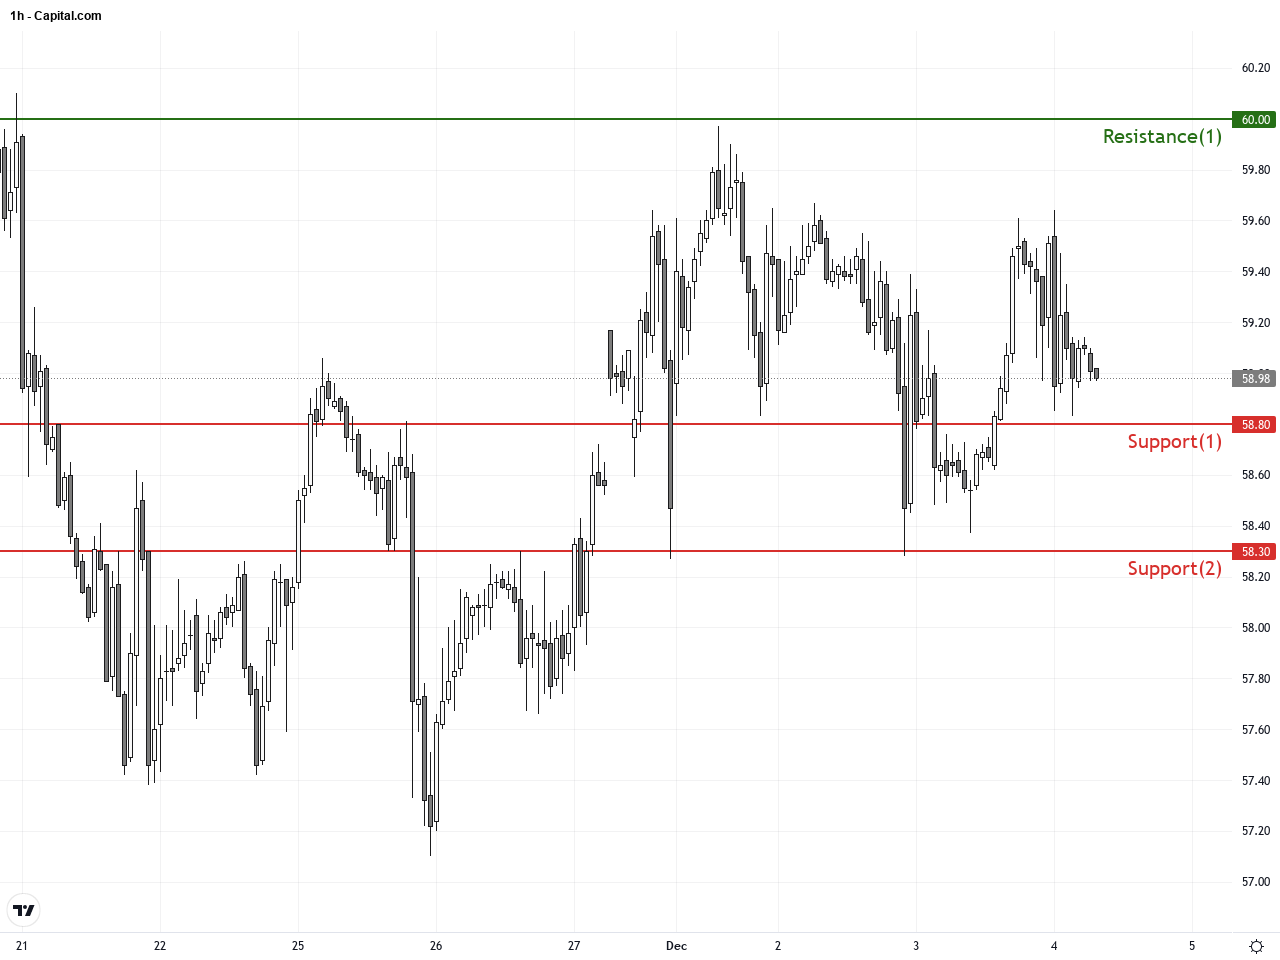
The critical technical insight is whether WTI can hold support at $59 and break through resistance near $60. MACD shows short-term bullish momentum complemented by a tightening Bollinger Bands and a bullish engulfing candlestick pattern, signaling higher probability of a trend-defining move soon. Increased trading volume would further confirm the breakout. Continued geopolitical tensions and supply uncertainty add volatility, creating a potential turning point in price direction.There are no major events directly impacting WTI crude oil in today’s economic calendar. However, traders should keep an eye on US inventory data and the US dollar movements as they have significant influence on oil prices. Considering the time difference between Hong Kong and major US trading sessions (approximately 13-14 hours), traders should adjust their strategies accordingly to avoid missing key volatility periods.
Resistance & Support
<
p style=”padding: 10px; margin: 20px 0; border: solid 1px #fa003f; border-radius: 5px;”>The above financial market data, quotes, charts, statistics, exchange rates, news, research, analysis, buy or sell ratings, financial education, and other information are for reference only. Before making any trades based on this information, you should consult independent professional advice to verify pricing data or obtain more detailed market information. 1uptick.com should not be regarded as soliciting any subscriber or visitor to execute any trade. You are solely responsible for all of your own trading decisions.