


 |
| Gold V.1.3.1 signal Telegram Channel (English) |

WTI Crude Oil: Triangular Breakout Signals Strong Uptrend Ahead
2025-12-02 @ 22:10
West Texas Intermediate (WTI) crude oil displayed volatile trading over the past 48 hours, closing at $59.19 per barrel on December 2, 2025, down $0.13 or approximately 0.22% from the previous trading day’s close of $59.32. Despite the modest pullback in the short term, oil prices remain supported by geopolitical risks as traders closely monitor Ukrainian drone strikes on Russian energy infrastructure and escalating U.S. threats toward Venezuela, both presenting significant supply disruption concerns.
The key driver of recent price action centers on intensifying geopolitical tensions. Ukrainian attacks on Russian Black Sea terminal facilities have disrupted oil shipments, with the Caspian Pipeline Consortium resuming operations at one mooring point following the disruption. Simultaneously, American sanctions threats against Venezuela heighten market concerns about global crude supply availability. These factors have maintained WTI oil around the $59 per barrel level, with underlying supply anxiety persisting beneath what appears to be a calm price surface. Traders remain acutely aware that supply disruptions represent a floor for prices, even amid broader economic headwinds.
On a monthly basis, WTI crude has declined 2.66% over the past month and is down 15.03% year-over-year, reflecting macroeconomic headwinds that include slowing global growth concerns and dollar strength pressures offsetting geopolitical support. However, recent impacts from reduced Russian oil exports and dollar weakness drove WTI to gain 1.32% on December 1, reaching $59.32, demonstrating market sensitivity to supply-side dynamics. Investors should monitor developments in the Ukraine conflict and U.S. policy toward Venezuela as critical reference points for determining crude’s directional bias ahead.
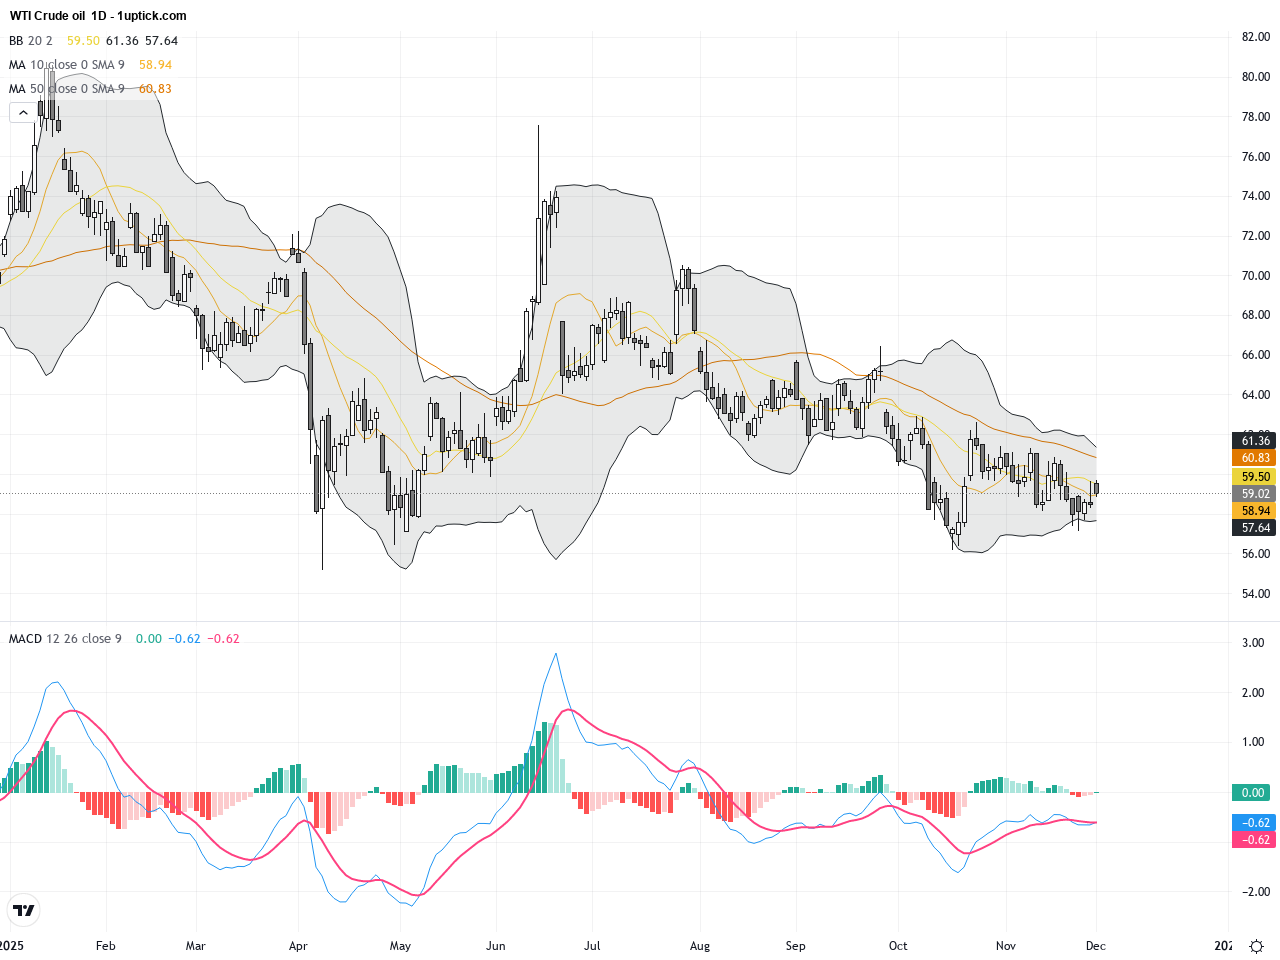
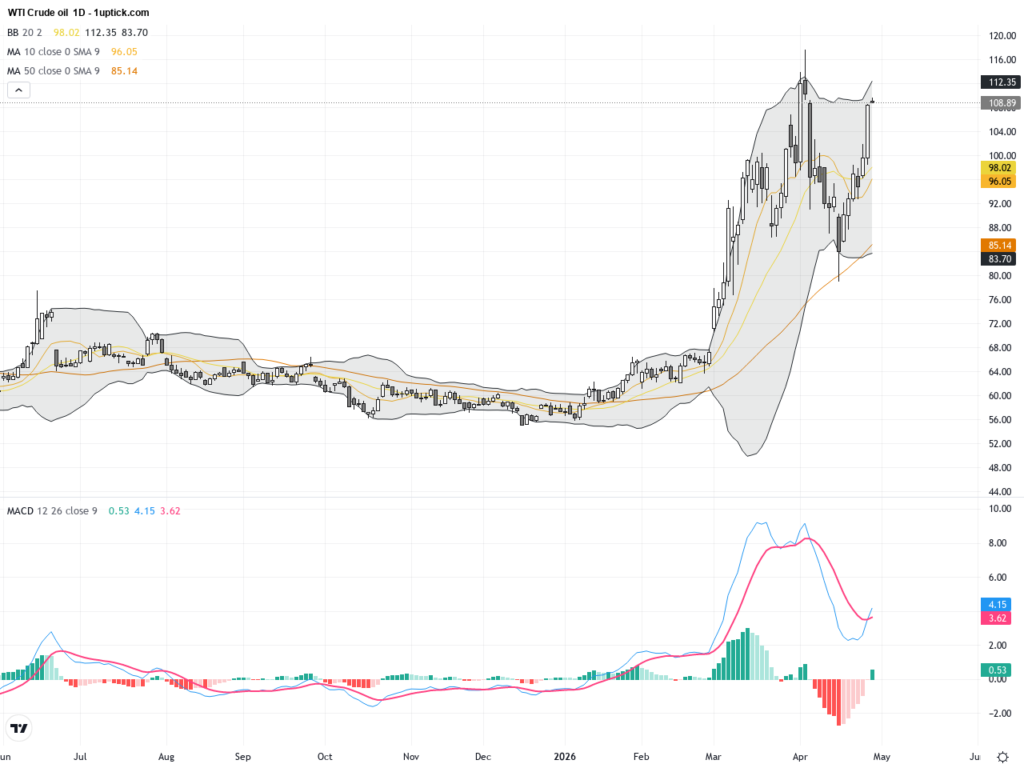
Examining the daily chart, WTI Crude Oil has maintained an ascending triangle pattern since mid-November, with prices repeatedly testing around $59.70 resistance. Recent days have seen a successful breakout above this level with closing prices holding firm, indicating strong bullish control. EMA lines align bullishly, the MACD signals sustained upward momentum, and Bollinger Bands widen, suggesting heightened volatility but confirmed upward trend direction.
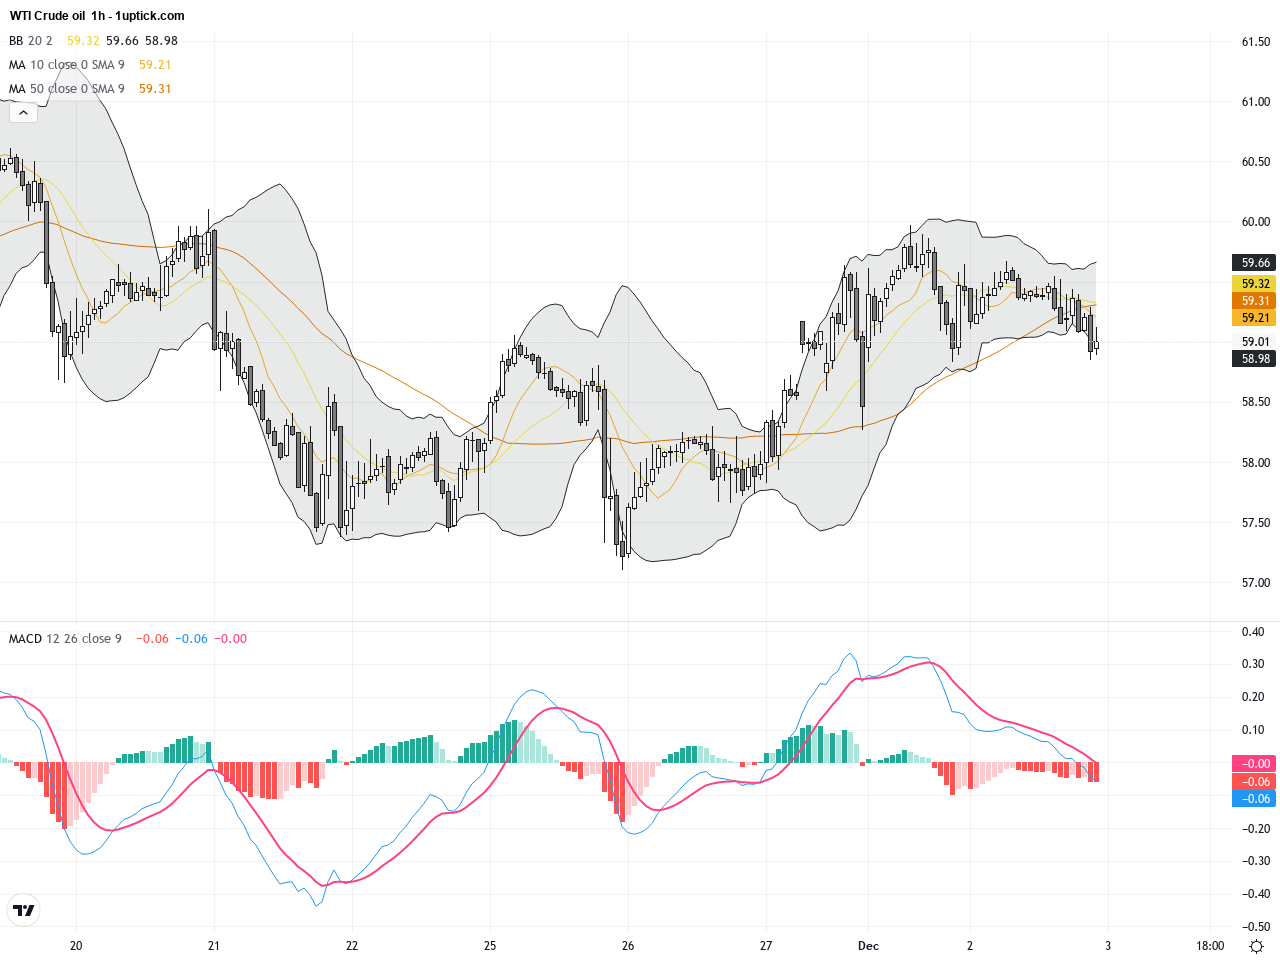
The hourly chart shows price consolidation within a symmetrical triangle between $58.90 and $59.70 over the last 3-5 days. In the last 24 hours, a breakout above the triangle’s upper boundary occurred with increased volume, accompanied by a bullish engulfing candlestick pattern confirming short-term buying interest. A MACD golden cross and RSI above 60 further support accelerating bullish momentum, pointing towards potential testing of the psychological $60 level shortly.
Technical Trend: WTI Crude Oil is currently in a clearly bullish uptrend, best described as “steadily bullish.”
Technically, the most prominent signal is the breakout of the ascending triangle pattern on the daily chart, affirming bull dominance and sustained upside momentum. The short-term bullish engulfing candlestick and MACD golden cross on the hourly chart offer compelling entry triggers for traders. Pay close attention to volume spikes to validate the breakout strength. On the fundamental side, geopolitical risks continue to underpin price strength, while record CME trading volumes reflect high market engagement and bullish sentiment overall.There are no major economic events scheduled today that directly impact WTI Crude Oil prices. Nonetheless, traders should monitor upcoming North American and European datasets related to crude inventories and energy supply reports later in the session. Geopolitical developments, particularly in Ukraine and Venezuela, remain catalytic in driving price movements despite the absence of immediate economic releases.
Resistance & Support

<
p style=”padding: 10px; margin: 20px 0; border: solid 1px #fa003f; border-radius: 5px;”>The above financial market data, quotes, charts, statistics, exchange rates, news, research, analysis, buy or sell ratings, financial education, and other information are for reference only. Before making any trades based on this information, you should consult independent professional advice to verify pricing data or obtain more detailed market information. 1uptick.com should not be regarded as soliciting any subscriber or visitor to execute any trade. You are solely responsible for all of your own trading decisions.