 |
| Gold V.1.3.1 signal Telegram Channel (English) |
Spot Gold (XAU/USD) 24-Hour Price Movement and Market Outlook
2025-04-29 @ 12:27
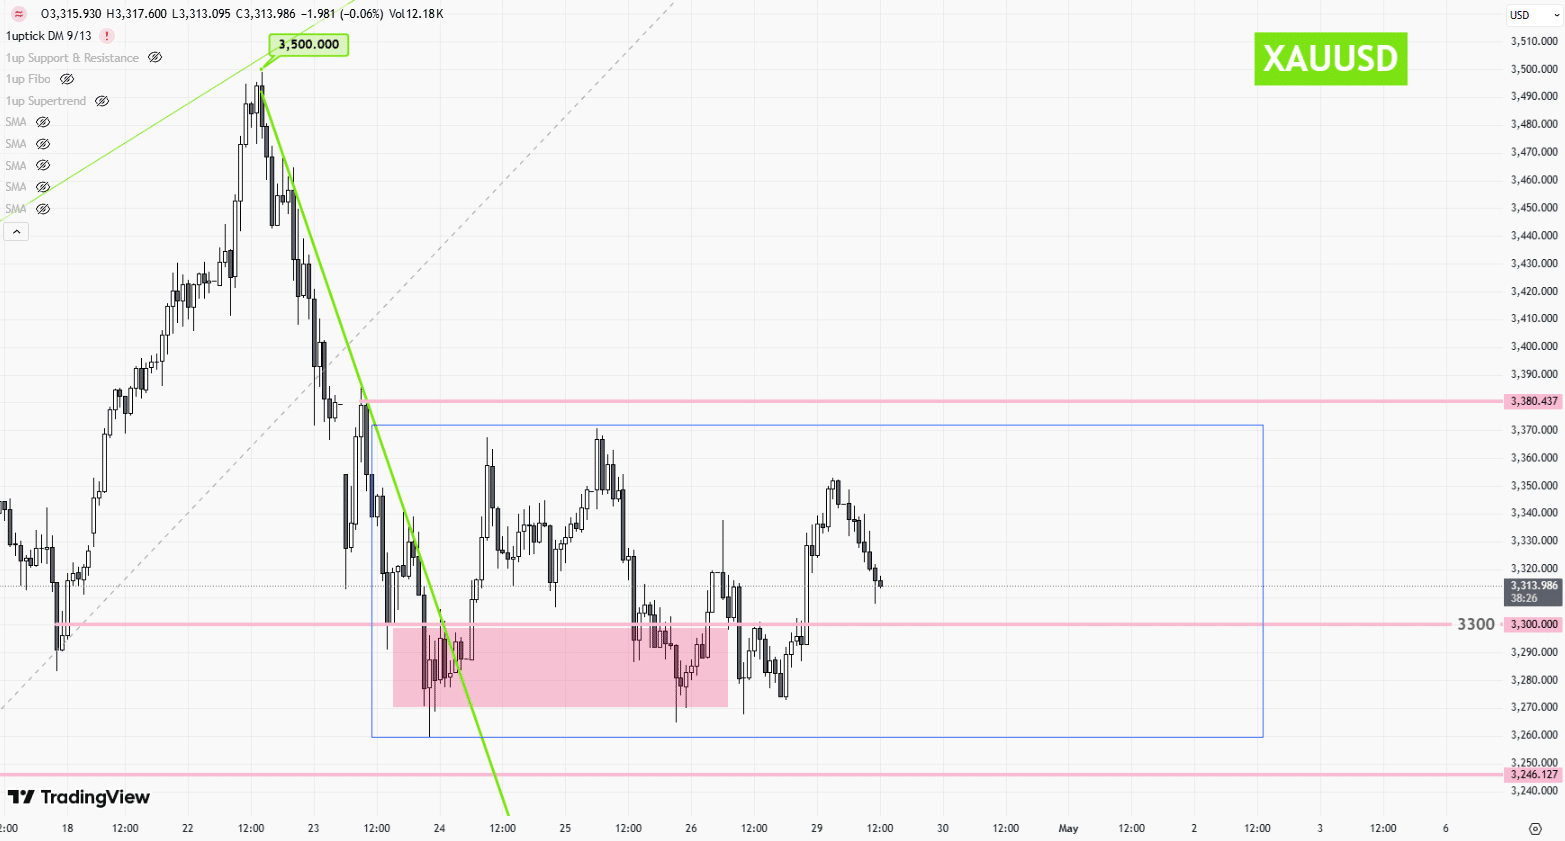
Over the past 24 hours, spot gold (XAU/USD) saw a volatile session, initially dipping before rebounding. During early trading on Monday in Asia, prices opened at $3,310 per ounce, pressured by a wave of optimism surrounding U.S.–China trade talks. That optimism dampened demand for safe-haven assets, sending gold briefly lower to an intraday low of $3,268. However, sentiment shifted in the afternoon as uncertainties re-emerged around the trade negotiations, reviving risk-off sentiment and sparking a swift gold rally. Prices peaked at $3,338 during U.S. trading hours and eventually settled at $3,347.80, posting a daily gain of roughly 0.86%.
Several key factors shaped gold’s movement. First, developments relating to U.S.–China tariff talks dominated market attention. Early in the session, signals from Washington suggested Beijing remained open to dialogue, leading investors to scale back on safe-haven exposure. But later in the day, U.S. officials clarified that no concrete agreements had been reached, and China offered no clear commentary, reigniting concerns over geopolitical risk and pulling capital back into gold.
Currency and bond market movements also played a role. The U.S. Dollar Index touched a session high of 99.22 in early trading, placing pressure on gold. Yet as the yield on the U.S. 10-year Treasury note fell back to 4.224%, real interest rates followed suit, weakening the dollar and providing gold with some upward momentum. At the same time, the ongoing corporate earnings season prompted some rotation out of large-cap equities and into defensive assets like gold. While the SPDR Gold ETF saw a modest outflow, futures positioning remained steady on the long side, suggesting that medium-to-long-term demand for gold continues to offer support.
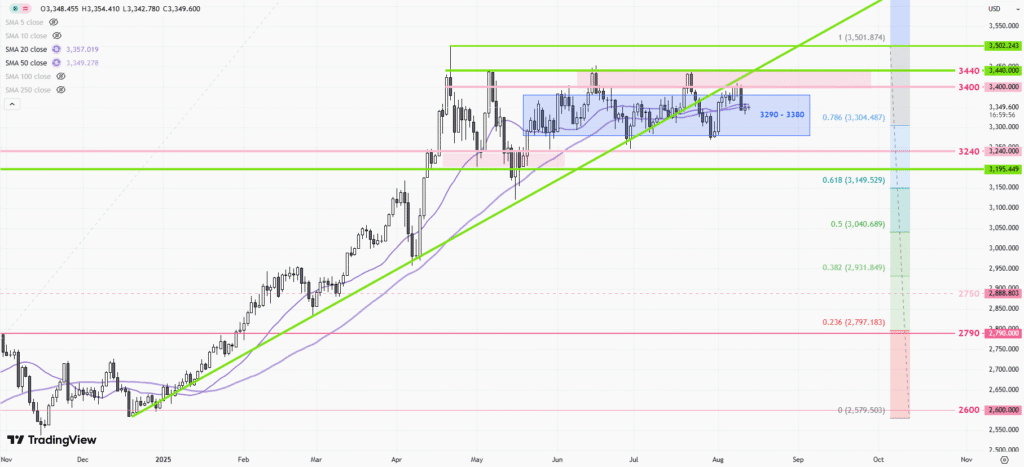
From a technical standpoint, the price rebounded quickly after testing support at $3,260, indicating strong buying interest at that level. The Relative Strength Index (RSI) bounced from recent lows, and gold remains within a rising channel—an encouraging sign that this could be a healthy pullback within a broader uptrend. Even though China reported a 6% year-over-year decline in first-quarter gold consumption, ETF holdings jumped more than 300% over the same period, signaling institutional investors’ persistent concerns about long-term inflation.
Looking ahead, the market’s attention will shift to upcoming macroeconomic data—specifically, U.S. first-quarter GDP (due April 30) and the nonfarm payrolls report (due May 2). Should this data point toward slowing economic momentum, expectations for Federal Reserve rate cuts later this year could strengthen, potentially offering further support for gold. On the technical side, immediate resistance lies near $3,370; a break above this level would pave the way toward the key $3,400 mark. Meanwhile, strong support remains in the $3,260–$3,300 range, a critical zone that bulls are likely to defend.


