


 |
| Gold V.1.3.1 signal Telegram Channel (English) |
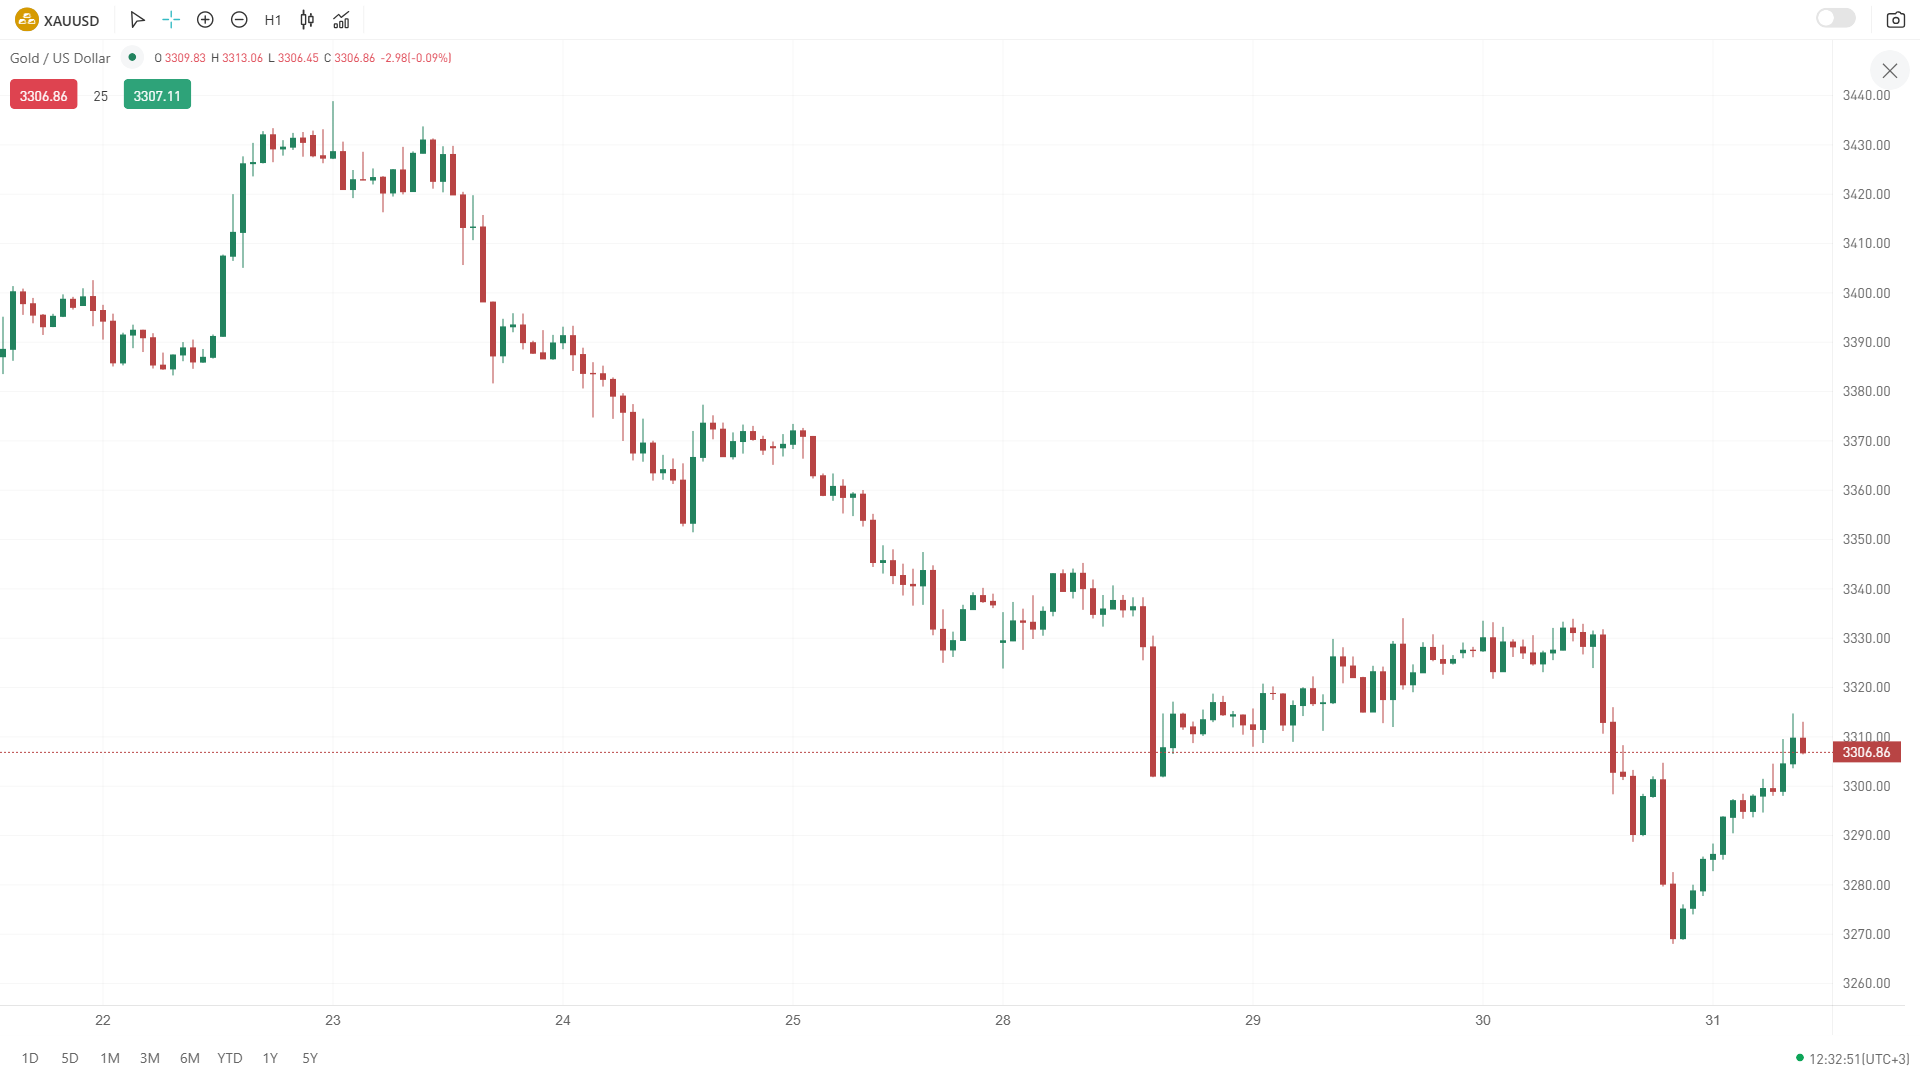
xauusd-1 hour
2025-07-31 @ 17:35
Market Overview
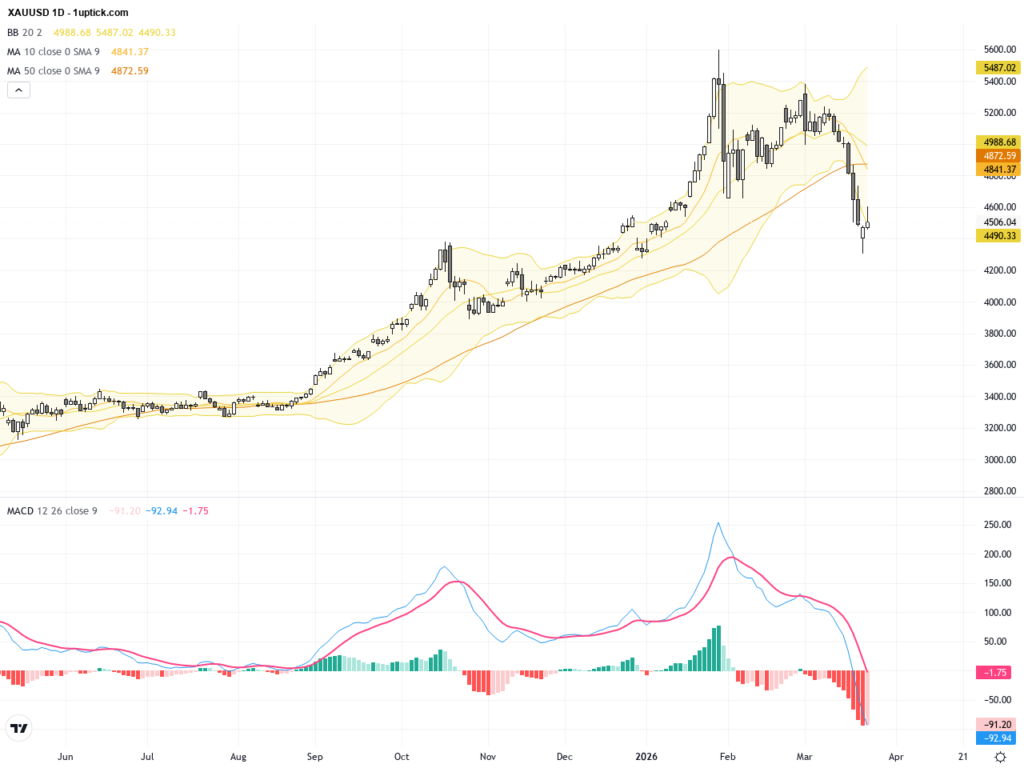
Gold (XAU/USD) has seen a relatively narrow trading range over the past week, hovering near $3,310 per ounce with no clear trend dominating the market. Price movement has been subdued, lacking a decisive direction as traders await major economic data. Key drivers of recent gold price fluctuations include shifting market sentiment ahead of major US employment figures, ongoing global trade policy developments, and investor uncertainty. Technical resistance and support levels have kept the market in check, with many participants cautious amid mixed signals from both fundamentals and technical outlooks. The prevailing environment suggests that gold is consolidating at current levels while traders watch for new catalysts that could determine its next move.
XAUUSD 1H Candlestick Chart Analysis: Technical Outlook for July 31, 2025
Current Technical Indicators and Their Signals
- Moving Averages (implied from price action): Price has recently traded below the 50-period EMA (as referenced on the daily), suggesting short-term bearish momentum. The moving averages have likely converged after the recent correction, with no clear bullish crossover visible.
- RSI: The RSI on higher timeframes (H4, Daily) hovers in the neutral to slightly bearish zone (around 45 on daily and bullish divergence suggested earlier), indicating momentum is neither overbought nor oversold but vulnerable to further downside, especially on breakdowns.
- Williams %R: Currently deep in oversold territory (below -79 on daily), typically preceding consolidation or a technical bounce rather than further heavy selling.
- MACD and Bollinger Bands: MACD appears to show bearish momentum, but there are early signs of momentum loss as price approaches major support. No obvious squeeze or sharp volatility expansion on Bollinger Bands is implied.
Prominent Chart Patterns
- Double Top / “M” Pattern: XAUUSD recently completed a significant double top near 3,421, leading to aggressive selling pressure. The formation confirms a bearish reversal, especially as price has since broken below the neckline area.
- Consolidation Zone: Price is now consolidating within a broad horizontal range, roughly between 3,343 and 3,302, with price action rotating inside this band and forming lower highs, indicative of continued distribution.
- Potential Descending Channel: Based on successive swing highs and lows, the market hints at a contained bearish channel.
Candlestick Patterns
- Recent Bearish Engulfing Candles: Multiple large-bodied bearish candles confirm strong supply entering the market after the double top. Some wicks below, forming near support, suggest buyers are attempting to absorb excess selling, but have not yet regained initiative.
- Doji/Spinning Top (at lower boundaries): Candlesticks with smaller bodies and longer wicks at support levels (around 3,302–3,310) imply indecision, increasing the probability of a short-term mean reversion or pause in the downtrend.
- Absence of Bullish Reversal Clusters: No clear bullish engulfing, hammer, or morning star patterns at major support — further downside risk remains present unless such formations emerge.
Trend Assessment
- Short-term Trend: Downtrend, following sharp rejection from major highs and clear break below moving averages.
- Intermediate Trend: Bearish, as the decline from the double top resolves toward lower chart support.
- Immediate Price Action: Range-bound, with a bearish bias rooted in the descending structure.
Major Support and Resistance Levels
Support:
– 3,310: Critical support, tested repeatedly as per recent price action; breakdown here exposes further momentum toward 3,296 and the broader 3,282–3,247 area.
– 3,295–3,282: Lower band of recent consolidation, next key zone for buyers to defend.
Resistance:
– 3,333–3,343: Immediate resistance formed by prior range highs and the midpoint of the ongoing consolidation.
– 3,347–3,357: Stronger resistance zone, aligning with previous swing highs and the neckline of the broken double top.
– 3,371–3,415: Upper major resistance, not likely in play unless a sharp reversal develops.
Additional Technical Insights
- Volume Trends: While not visible directly, the nature of the sharp moves down and subsequent choppy consolidation is suggestive of profit-taking after capitulation, but no clear accumulation is yet evident.
- Momentum Shifts: The lack of a pronounced bullish reversal pattern underpins ongoing short-term bearish bias; momentum indicators like RSI and MACD signal further risk to the downside, unless a confirmed reversal forms above support.
Actionable Technical Outlook
XAUUSD remains under pressure, with technicals favoring a continuation of the short-term downtrend unless the 3,310 support is reclaimed convincingly. Immediate risk is for a test of 3,295–3,282, with the potential for further selling toward 3,247 if support fails. Short-side setups are favored below resistance (3,333–3,343) with tight risk controls, while only a decisive reversal pattern or bullish engulfing above 3,343 would neutralize immediate downside risk and open the path back toward 3,357–3,371. Traders should closely watch for emergence of strong reversal candlesticks or a volatility spike, as signs of exhaustion near multi-session lows.
*Summary: Maintain a bearish-to-neutral stance while price remains capped below 3,343, with sell rallies and breakout shorts preferred until technical evidence of a robust bullish reversal appears.