 |
| Gold V.1.3.1 signal Telegram Channel (English) |

Gold Poised for Breakout as Symmetrical Triangle Signals Potential Major Move
2025-08-21 @ 19:00
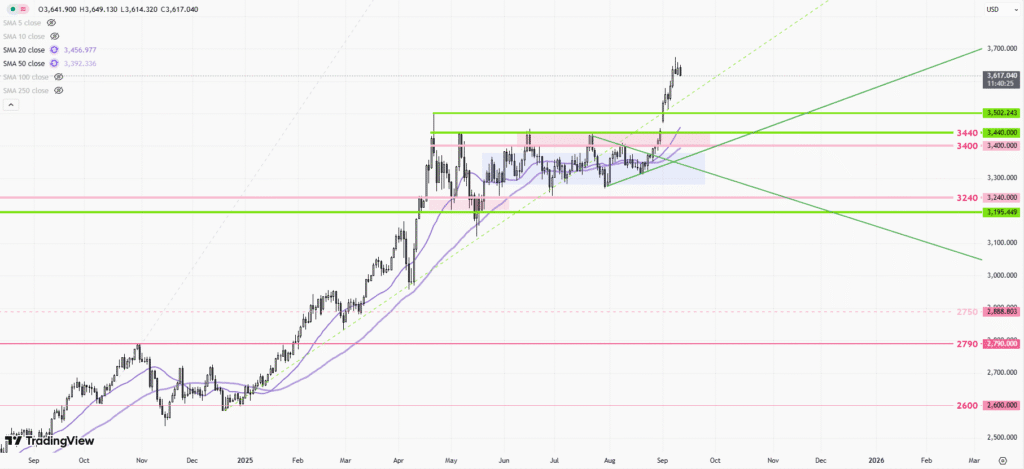
Gold (XAU/USD) is showing renewed bullish momentum as it navigates the boundaries of a symmetrical triangle—a key technical pattern that often signals major upcoming moves. This classic chart formation, which appears when price action experiences a period of consolidation, is drawing the attention of market participants looking for the next directional breakout.
Understanding the Symmetrical Triangle Pattern
A symmetrical triangle is a technical pattern marked by two converging trendlines—one sloping down (resistance) and the other sloping up (support). This convergence reflects a market in a state of indecision: buyers and sellers push the price toward each other, resulting in a narrowing trading range that resembles a triangle. The pattern indicates that neither bulls nor bears have firm control, and it often precedes significant price movements when the stalemate finally resolves.
The symmetrical triangle is considered neutral because it doesn’t inherently favor a bullish or bearish breakout; rather, its ultimate direction is determined at the moment price breaks through either the upper resistance or lower support line. This setup can herald either a continuation of the previous trend or a major reversal, depending on broader market conditions and the nature of the breakout.
Why Gold Traders Are Watching This Pattern
Gold’s current consolidation inside the symmetrical triangle suggests that market volatility is contracting and pressure is building for a decisive move. Historically, gold often follows established trends after periods of consolidation, especially if the initial move was strong. In the current scenario, gold’s entrance into this pattern comes after an upward trend, fueling speculation that a breakout above the triangle’s upper boundary could trigger renewed bullish momentum and propel prices higher.
However, traders know not to jump in prematurely. Reliable confirmation of a breakout is crucial. This typically comes in the form of a strong, closing candle above the upper trendline for a bullish breakout or below the lower trendline for a bearish reversal. Accompanying volume is also a key consideration: a true breakout is usually supported by a noticeable increase in trading activity, underscoring the conviction behind the move.
How Traders Approach Triangle Breakouts
Trading the symmetrical triangle effectively requires a disciplined plan:
- Entry: Traders often wait for a confirmed breakout—a candle closing decisively outside the triangle’s boundary—before entering a trade in the direction of the break.
- Stop-Loss Placement: Risk management is paramount. Stop-loss orders are commonly set just outside the opposite side of the triangle to guard against false breakouts or rapid reversals.
- Target Setting: Many traders calculate price targets by measuring the vertical distance from the triangle’s highest to lowest point at its widest section and projecting that distance from the breakout point. This helps estimate how far the price might travel should the pattern play out as expected.
For instance, if gold’s symmetrical triangle began with price swings between $2,000 and $2,050, and the eventual breakout occurs around $2,025, then a potential target would be $2,025 + $50 = $2,075 in the case of an upside move.
Key Considerations Beyond the Chart
While the triangle pattern itself is a powerful signal, experienced traders don’t rely solely on chart patterns for critical decisions—especially in a volatile, macro-driven market like gold. They often integrate technical triggers with awareness of economic data, macroeconomic trends, central bank policy, and changes in market sentiment. Unexpected headlines or shifts in global risk appetite can quickly invalidate chart setups.
Volume analysis serves as another critical filter. Breakouts with minimal volume tend to be less reliable and are more prone to failure or quick reversals. Conversely, when a breakout is accompanied by a surge in volume, it indicates genuine market conviction and increases the likelihood of trend continuation.
Symmetrical Triangles on Different Timeframes
Another important aspect is the timeframe of the pattern. Symmetrical triangles forming on daily or weekly charts tend to produce stronger and more meaningful breakouts than those on shorter timeframes. This is because longer-term patterns reflect deeper levels of accumulation or distribution and usually involve larger pools of capital.
What’s Next for Gold?
At the crossing point of the current symmetrical triangle, gold is in a classic “wait and see” phase. If bulls can propel prices above the upper resistance line on convincing volume, a new surge toward higher highs is likely, with targets set by the measured move. Conversely, a breakdown below support could trigger swift declines as trapped long positions exit and momentum sellers step in.
For now, traders and investors alike should monitor key support and resistance levels, wait for breakout confirmation, and prepare to act swiftly once directionality is clear. The coming resolution of this symmetrical triangle could set the tone for gold’s next significant move, creating both opportunities and risks for the months ahead.


