![[Daily Closing 🔔] Gold – Gold Prices in New York Swing Sharply as Geopolitical Tensions and Dollar Strength Drive Market Uncertainty](https://int.1uptick.com/wp-content/uploads/2025/05/2025-05-22T235933.071Z-file-1024x576.png)
 |
| Gold V.1.3.1 signal Telegram Channel (English) |
USD maintain in a downtrend channel!
2025-02-23 @ 15:52

Price Movement
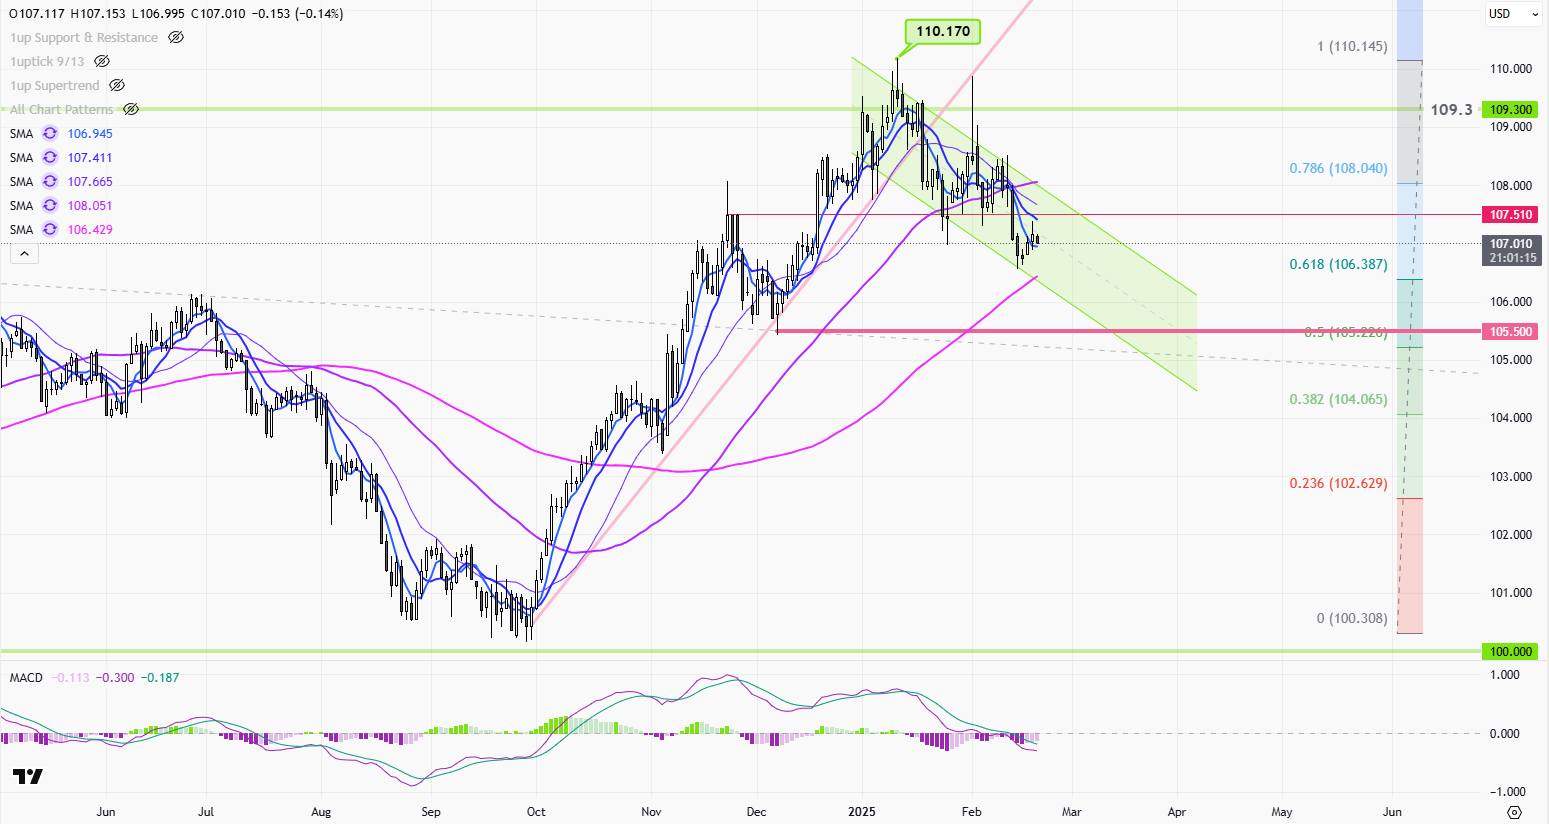
The USD Index daily chart shows a recent period of volatility with notable price shifts. Initially, the index experienced an upward trend, reaching a peak near 110.170. This rise was followed by a pullback, as sellers gained control, leading to increased bearish sentiment. The chart indicates a series of lower highs and lower lows, typical of a downtrend, before finding temporary support around the 106 level. The presence of Doji candlesticks signifies market indecision, while recent trading sessions show a consolidation phase within a descending channel. The index has tested key Fibonacci retracement levels, suggesting potential support and resistance zones. The indicators suggest a cautious market, reacting to economic and geopolitical influences, with the potential for further volatility.
Technical Analysis
| Pattern/Indicator | Analysis |
|---|---|
| Descending Channel | Indicates a bearish trend, with potential breakdowns at lower trendline levels. |
| Fibonacci Retracement Levels | Critical levels include 61.8% (106.387) acting as potential support. |
| Simple Moving Averages (SMA) | The price is hovering around the 50-day SMA; crossing below indicates bearish momentum. |
| MACD Indicator | Shows negative divergence suggesting bearish momentum might continue. |
Outlook
Given the current trends, the USD Index appears to be in a consolidation phase within a broader downtrend, as indicated by technical indicators and price actions. The descending channel suggests further downside potential unless the index breaks above the upper trendline convincingly. Watch for any significant price moves around the 61.8% Fibonacci level and the 50-day SMA, as these could indicate shifts in market sentiment. The MACD suggests ongoing bearish pressure, but any crossover could signal a potential reversal or shift to bullish momentum. Traders should remain cautious and consider external economic factors that could provoke rapid price movements.
Support and Resistance
| Support Levels | Resistance Levels |
|---|---|
| 105.500 | 107.510 |
| 104.065 | 109.300 |
| 102.629 | 110.145 |