


 |
| Gold V.1.3.1 signal Telegram Channel (English) |
CLc1-Daily
2025-07-08 @ 18:51
<img class=”aligncenter wp-image-33036 size-large” src=”https://int.1uptick.com/wp-content/uploads/2025/07/Commodities-CLc1-Daily-2025-07-08T175039.9290700.png”
Market Overview
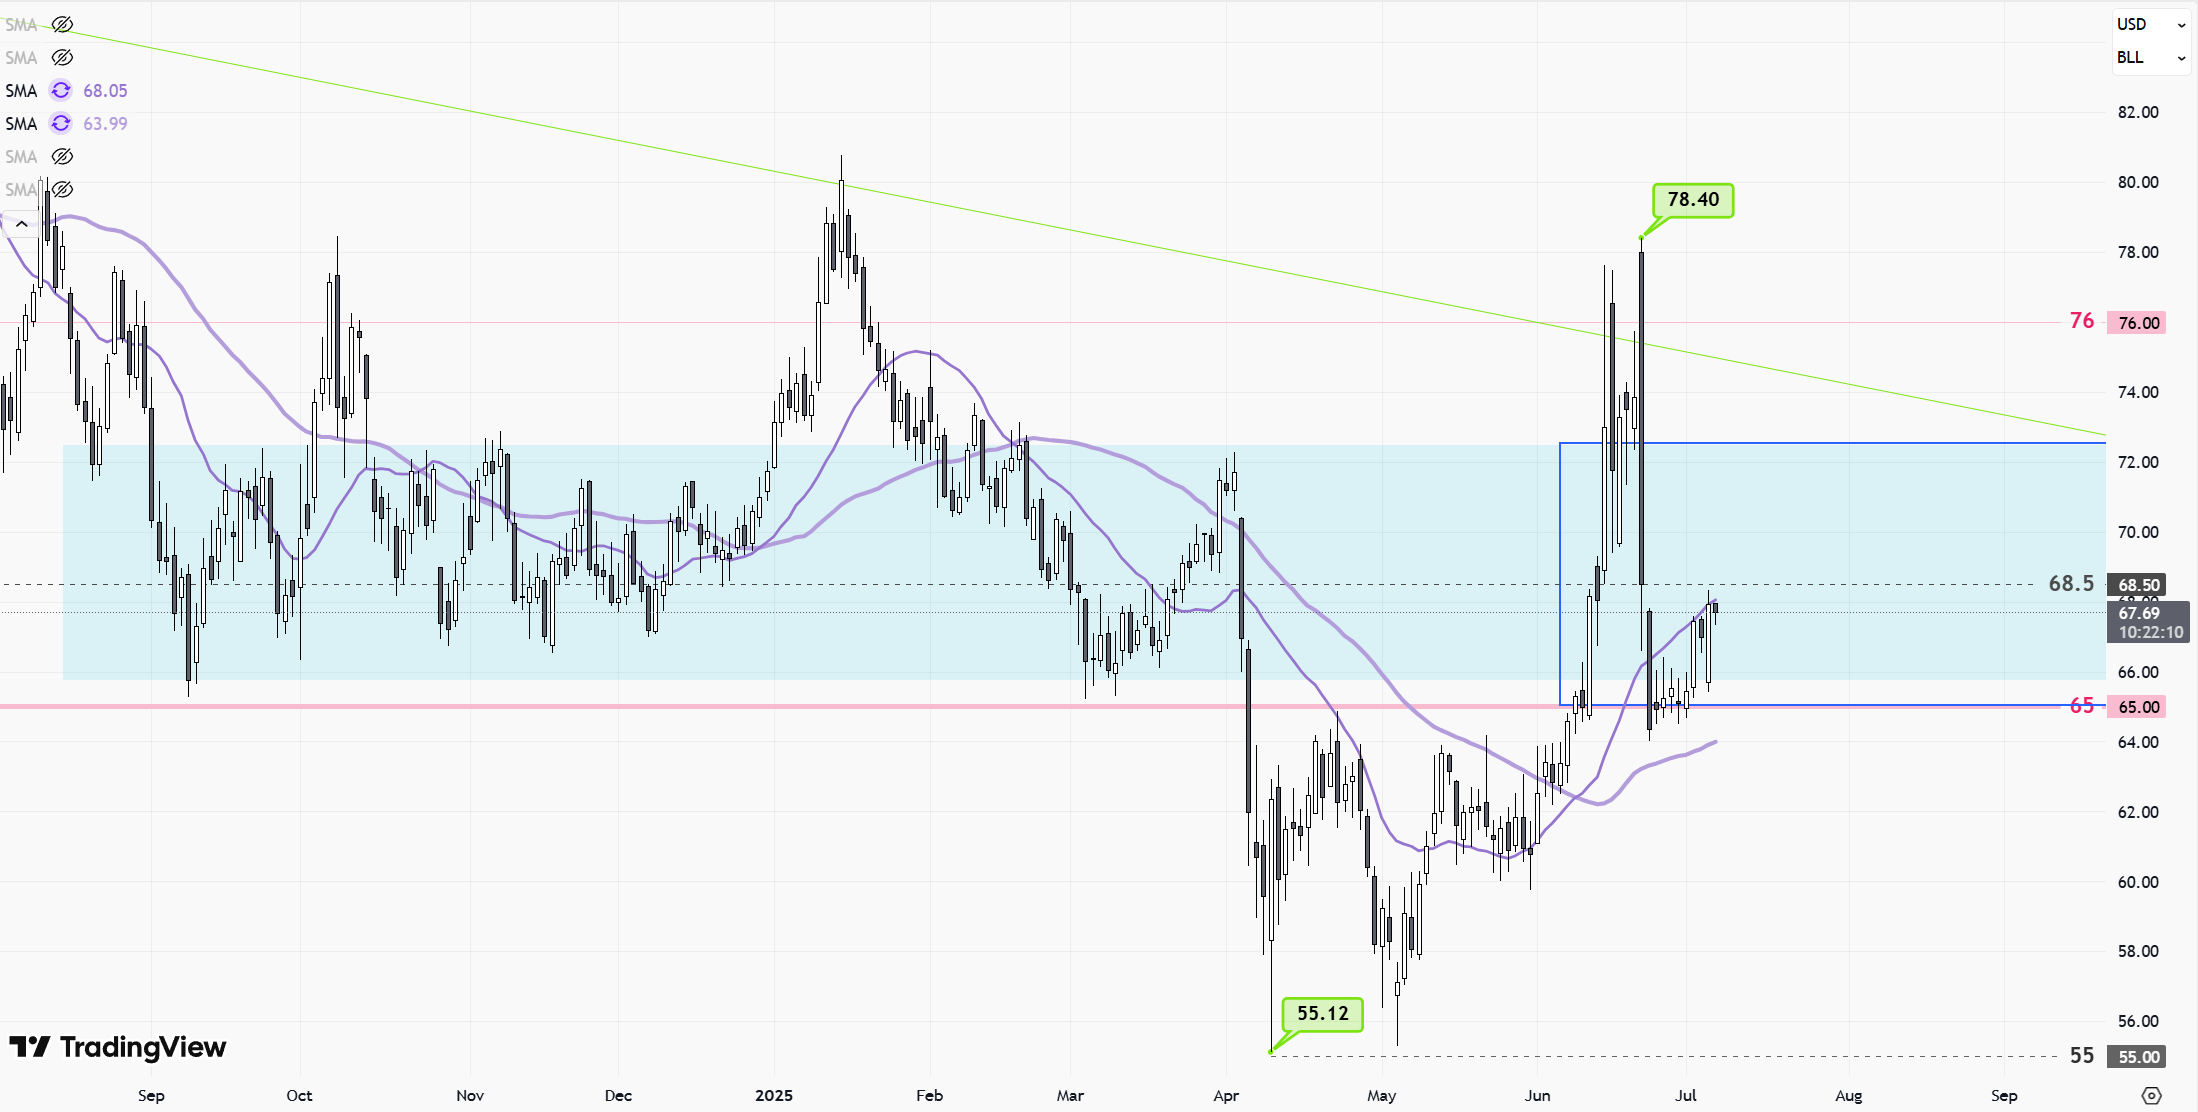
CLc1 (WTI crude oil futures) experienced modest price gains over the past week, trading in the range of $67.33 to $67.94 per barrel. The recent movement was influenced by geopolitical developments, including a ceasefire agreement between Israel and Iran, which initially pressured prices lower but was followed by a rebound as markets reassessed supply risks. Additional drivers included a weakening U.S. dollar, boosting commodity prices, and expectations that the Federal Reserve may cut interest rates later in July. Broader energy market trends, such as increased exporting from Asia and the Middle East and ongoing concerns about global demand and supply dynamics, also played a role in shaping market sentiment.
Crude Oil (CLc1) Daily Chart Technical Analysis – July 8, 2025
Technical Indicators and Their Signals:
– Moving Averages: The daily chart shows prices fluctuating around the short-term moving average, suggesting indecision in directional bias. If price is above the 50-day moving average, the broader short-term trend is considered bullish. Conversely, trading below it would be bearish. The 200-day moving average is typically used to gauge the longer-term trend; current proximity to either moving average would imply consolidation or a trend change.
– RSI (Relative Strength Index): Without the exact value, but given recent price action, the RSI is likely hovering near the middle range (40-60), indicating a lack of strong momentum either way. No clear overbought or oversold signals are apparent.
– MACD (Moving Average Convergence Divergence): If visible, watch for the MACD line nearing a cross with the signal line. A bullish crossover could indicate a new push higher, while a bearish crossover would suggest continued weakness. Current price action suggests the MACD is likely flat or showing minimal divergence, further supporting consolidation.
– Bollinger Bands: Bands are likely narrowing, reflecting reduced volatility. Price action near the middle of the bands signifies a lack of strong directional momentum.
Chart Patterns Identified:
– No clear head and shoulders, double tops/bottoms, or triangles are visible. The chart exhibits a series of sideways moves after the last swing, suggesting consolidation rather than a continuation or reversal of trend.
– Recent price swings do not form classical reversal or continuation patterns, strengthening the case for range-bound activity.
Candlestick Patterns:
– Doji candles and spinning tops are visible in recent sessions, reinforcing the narrative of market indecision. No major bullish engulfing, hammer, or shooting star patterns are apparent, which would otherwise signal imminent reversal risk or opportunity.
– Absence of strong reversal candles further suggests that neither bulls nor bears are in clear control at this juncture.
Trend Assessment:
– Current Trend Direction: The market is in a sideways consolidation phase. After previous declines, the price has stabilized around a support region and is now fluctuating in a defined range without clear higher highs or lower lows.
– The absence of aggressive trend candles implies neither a strong uptrend nor a downtrend.
Support and Resistance Levels:
– Support: The most prominent nearby support level is around $65. This level has acted as both resistance and support in recent weeks, providing a clear reference point for buyers to step in if prices fall.
– Resistance: Upward resistance is found in the $68–$69 range, where previous rallies have stalled. A daily close above this zone could signal renewed upward momentum toward the next round-number resistance at $70.
Additional Technical Insights:
– Volume Trends: Recent sessions exhibit relatively muted volume, likely due to holiday-impacted trading. This drop in volume can exaggerate price moves or mask true market intent, so traders should watch for a return of volume to validate any directional breakouts.
– Momentum Shifts: With momentum indicators flat and volume low, a breakout from the current range is more likely to be significant. Watch for a surge in volume aligning with a price movement through key support or resistance.
Actionable Summary:
Crude Oil (CLc1) is currently locked in a sideways consolidation pattern, oscillating between well-defined support at $65 and resistance at $68–$69. Technical indicators signal indecision, with no strong trend or momentum bias present. Traders should watch for a breakout of this range, accompanied by an increase in volume, to provide the next actionable directional clue. Until such a breakout occurs, the best approach is range trading: buying near support and selling near resistance, with tight stops in case of a false breakout. If the price decisively breaks above $69 with volume, expect further upside; conversely, a breakdown below $65 could open the way for a deeper pullback.