![[Daily Closing 🔔] Gold – Gold Prices in New York Swing Sharply as Geopolitical Tensions and Dollar Strength Drive Market Uncertainty](https://int.1uptick.com/wp-content/uploads/2025/05/2025-05-22T235933.071Z-file-1024x576.png)
![[Daily Closing 🔔] Gold – Gold Prices Climb to New Highs on Tuesday as Weaker Dollar Boosts Safe-Haven Demand](https://int.1uptick.com/wp-content/uploads/2025/05/2025-05-22T004512.731Z-file-1024x576.png)
 |
| Gold V.1.3.1 signal Telegram Channel (English) |

DOW 30 on its way to 42000!
2025-03-05 @ 11:22
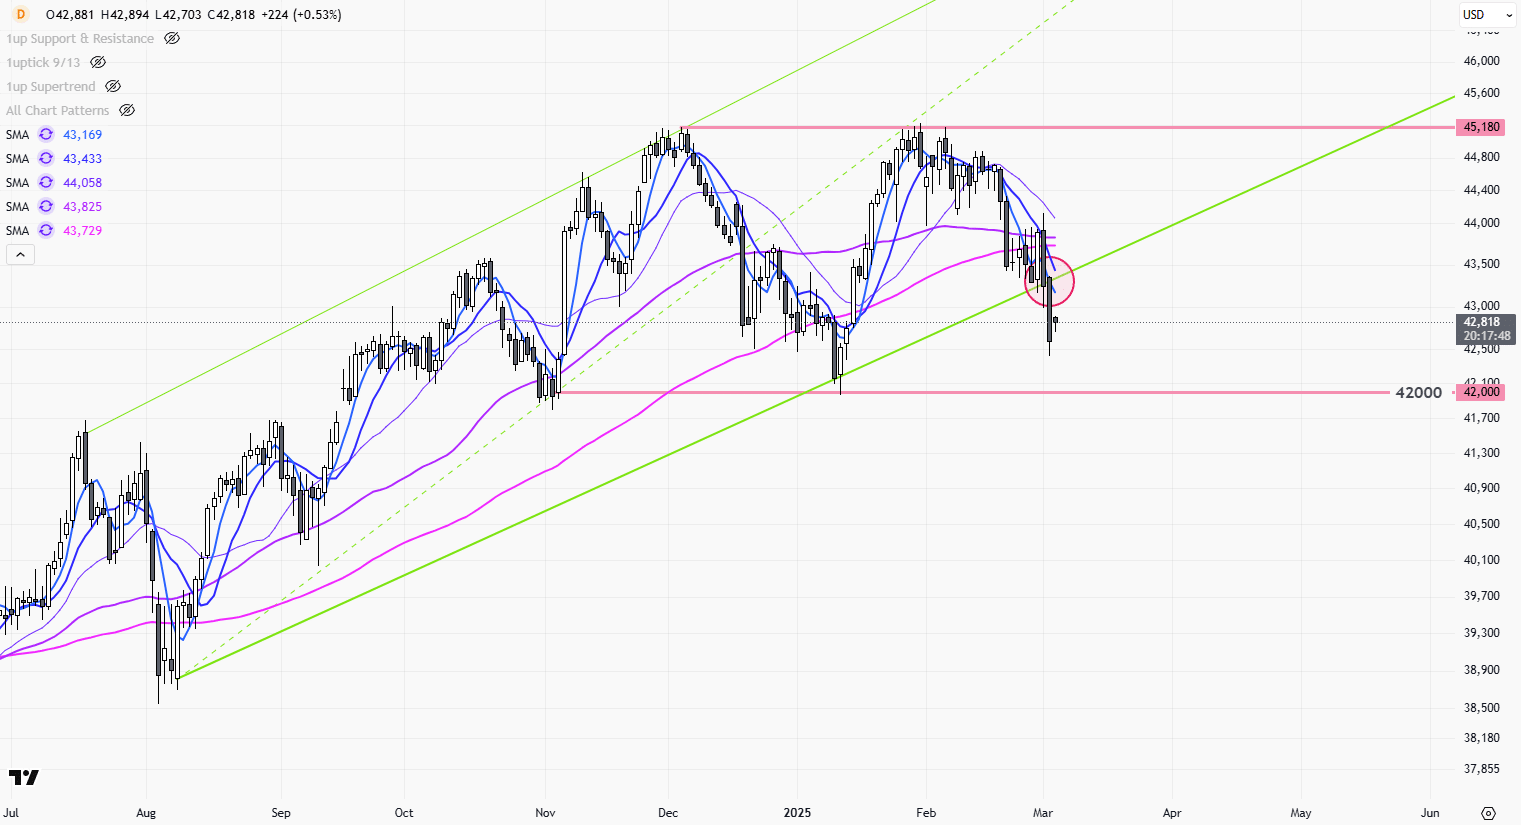
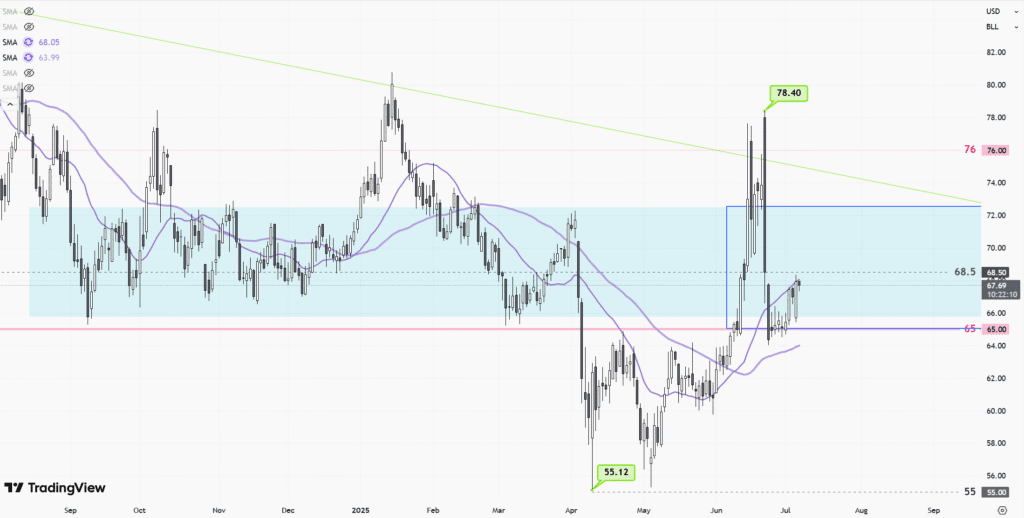
Price Movement
The daily chart of the S&P depicts a fluctuating trend with periods of both bullish and bearish sentiment. Initially, there is a significant uptrend, indicated by a series of higher highs and higher lows, sustaining above the green upward channel. As the chart progresses, the price encounters resistance around the 45,180 level, subsequently leading to a reversal. The market begins to form a descending pattern with lower highs and breaches the lower boundary of the upward channel, suggesting a shift in market sentiment. Recently, prices approached the 42,000 support level and seem to have rebounded slightly, indicating potential buyers entering the market at this critical juncture.
Technical Analysis
| Technical Pattern/Indicator | Analysis |
|---|---|
| Ascending Channel | The initial uptrend within the channel indicated strong buying pressure. The breach of the channel’s lower boundary suggests potential weakness and a bearish reversal. |
| Simple Moving Averages (SMA) | The SMAs are moving closer to each other, indicating reduced momentum. Crossings of the SMAs could further suggest potential trend reversals or continuations depending on the direction. |
| Support at 42,000 | Strong support around 42,000 may act as a buying zone where the price could rally if it holds; a failure to hold could signal further bearish movement. |
Outlook
The current outlook for the S&P is cautious, as the price has experienced a significant bearish movement breaking below the previous ascending channel. However, the strong support level at 42,000 may indicate potential for a rebound. Investors should watch closely for confirmation signals either for a continuation of the upward recovery or a failure of support. Technical indicators such as SMA crossings and momentum shifts should also be observed for further insight into future price action. The overarching sentiment seems to be uncertain with distinct resistance and support levels dictating future movements.
Support and Resistance
| Support Levels | Resistance Levels |
|---|---|
| 42,000 | 45,180 |
| 41,500 | 44,500 |
| 40,500 | 44,000 |