


 |
| Gold V.1.3.1 signal Telegram Channel (English) |

EUR ready to breakout 1.05?
2025-03-04 @ 17:23
Price Movement
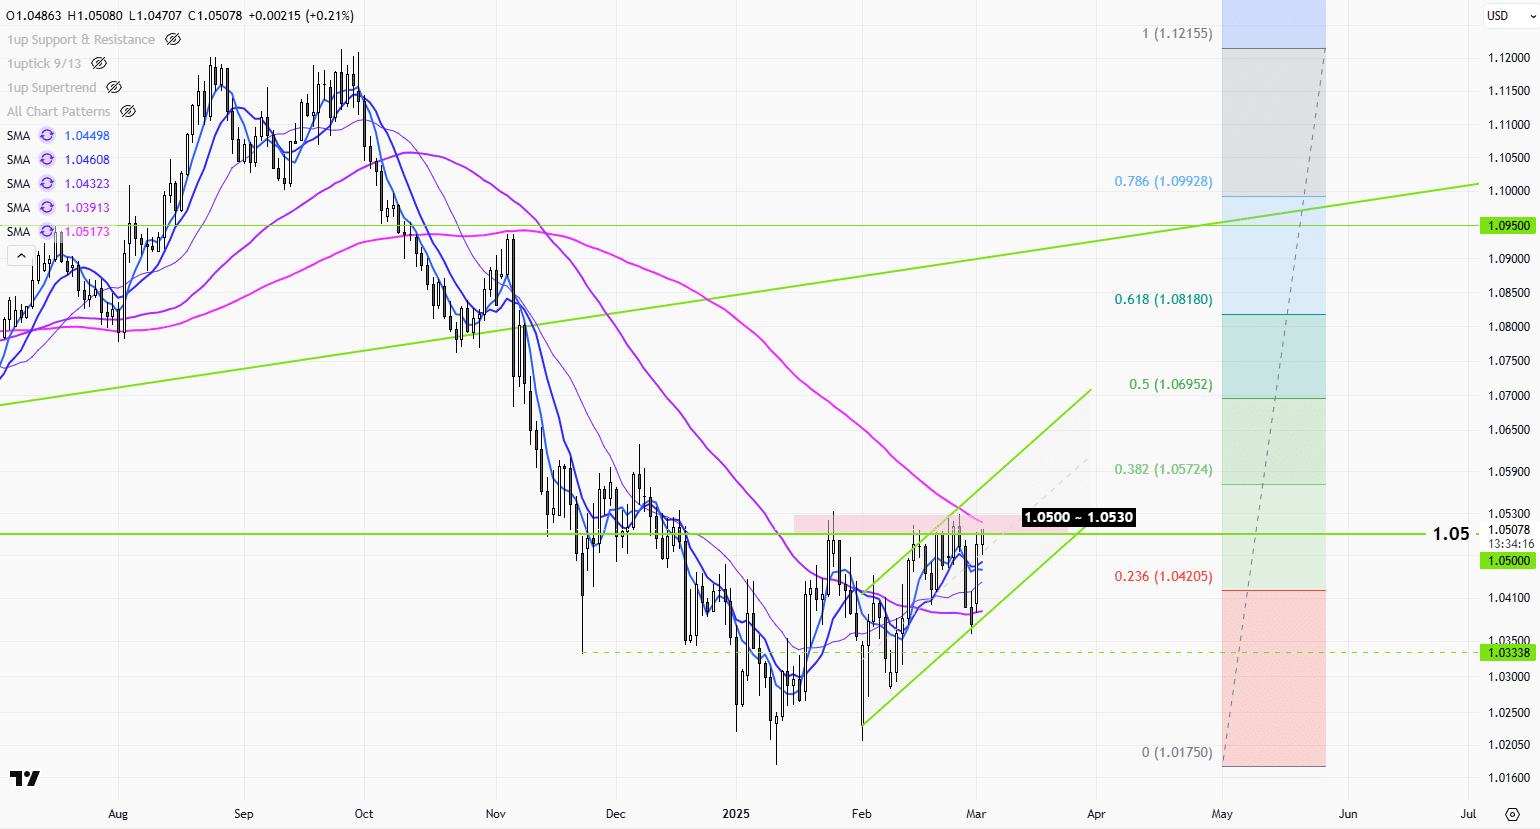
The EUR/USD daily chart shows prolonged bearish movement followed by a consolidation period. Initially, the pair experienced a significant downward trend as indicated by consecutive lower lows and lower highs. A reversal was attempted, but resistance around the 1.0500-1.0530 range halted further upward movement. Throughout the period under consideration, the price oscillated within an intermediate triangle pattern formed by converging trend lines, suggesting a market in the indecision phase. The weight of the 200-day SMA remains overhead, highlighting persistent long-term bearish sentiment. Recent candlesticks display attempts to break above resistance, met with seller pressure, indicating indecisiveness, but also potential for a shift if broken decisively.
Technical Analysis
| Technical Pattern/Indicator | Analysis |
|---|---|
| Triangle Pattern | The converging trend lines define a symmetrical triangle, suggesting potential breakout direction. Continuation of the trend typically occurs in the existing direction (down), but breakouts can go either way. |
| Simple Moving Averages (SMA) | The 50-day SMA has crossed below the 200-day SMA earlier, confirming the ‘death cross’ and signaling potential for prolonged bearish movement. The pair is currently testing the 50-day SMA from below. |
| Fibonacci Retracement Levels | Retracement levels are marked at 0.382 (1.0574), 0.50 (1.06952), etc. The price tested but did not decisively breach the 0.236 level, suggesting weakening of bearish momentum. |
Outlook
The current outlook for EUR/USD remains cautiously bearish with chances of potential reversal if key resistances are broken. The symmetrical triangle indicates consolidation, with an impending breakout being likely. Traders should watch for a decisive closing beyond the triangle pattern for trend direction. A break above the 1.0500-1.0530 could suggest bullish reversal and target higher Fibonacci levels. Alternatively, failure to sustain above the 50-day SMA might indicate a resumption of downward momentum, potentially testing next support levels.
Support and Resistance
| Support | Resistance |
|---|---|
| 1.0338 | 1.0530 |
| 1.0500 | 1.0574 |
| 1.04205 | 1.0950 |