![[Daily Closing 🔔] Gold – Gold Prices in New York Swing Sharply as Geopolitical Tensions and Dollar Strength Drive Market Uncertainty](https://int.1uptick.com/wp-content/uploads/2025/05/2025-05-22T235933.071Z-file-1024x576.png)
![[Daily Closing 🔔] Gold – Gold Prices Climb to New Highs on Tuesday as Weaker Dollar Boosts Safe-Haven Demand](https://int.1uptick.com/wp-content/uploads/2025/05/2025-05-22T004512.731Z-file-1024x576.png)
![[Daily Closing 🔔] Gold – Gold Prices Surge Nearly 2% to $3,287.60 as Weaker US Dollar Fuels Rally](https://int.1uptick.com/wp-content/uploads/2025/05/2025-05-20T224010.678Z-file-1024x576.png)
 |
| Gold V.1.3.1 signal Telegram Channel (English) |
[Daily Closing 🔔] Gold – Gold Price Outlook: Impact of U.S. Jobs Data and China-U.S. Trade Relations on Global Spot Gold Trends
2025-05-03 @ 14:17
Over the past 24 hours, international spot gold prices have pulled back noticeably and entered a phase of consolidation. By Friday’s close in U.S. Eastern Time, gold settled at $3,255.01 per ounce, recovering slightly from the day’s low of $3,211.53. Still, it ended the week down 2.1%, snapping a four-week winning streak. The market is paying close attention to the latest U.S. nonfarm payroll data, developments in U.S.-China trade relations, and the Federal Reserve’s future interest rate policy—key drivers currently influencing the direction of gold prices.
The latest April nonfarm payrolls report came in stronger than expected, showing 177,000 jobs added. While that’s lower than March’s revised figure of 185,000, it’s significantly higher than the market’s forecast of 138,000—highlighting continued resilience in the labor market. Average hourly earnings rose 0.2% on the month, slightly below expectations of 0.3%. This data dampened hopes for a near-term rate cut by the Fed, pushing up the U.S. dollar and Treasury yields—both of which reduced the appeal of gold, a non-interest-bearing asset. Earlier in the week, weaker-than-expected private payroll figures from ADP had raised concerns about economic slowing, briefly boosting safe-haven demand for gold. However, the nonfarm data eased that tension, leading some traders to take profits off the table.
Meanwhile, positive developments in U.S.-China trade relations also dulled demand for safe-haven assets. The U.S. President announced that tariff negotiations with China have resumed, rekindling hopes for a potential agreement and shifting sentiment toward risk assets. This shift further weighed on gold buying, while China’s physical gold market paused due to the Labor Day holiday, reducing near-term demand and adding downward pressure to prices. Still, despite the improved market mood, underlying risks remain: lingering uncertainties in U.S.-China trade talks and weakness in China’s manufacturing sector—its April PMI fell to 49.0—may continue to lend medium- to long-term support to gold.
As for the Fed’s policy outlook, uncertainty persists. Despite the upbeat jobs report, first-quarter U.S. GDP unexpectedly contracted by 0.3%, and wage growth is stalling. These mixed signals leave the door open for a potential rate cut later this year. Currently, futures markets are pricing in a 65% chance of a rate cut by September, slightly lower than the 70% probability seen before the jobs report. This cautious stance has contributed to gold’s sideways movement at elevated levels.
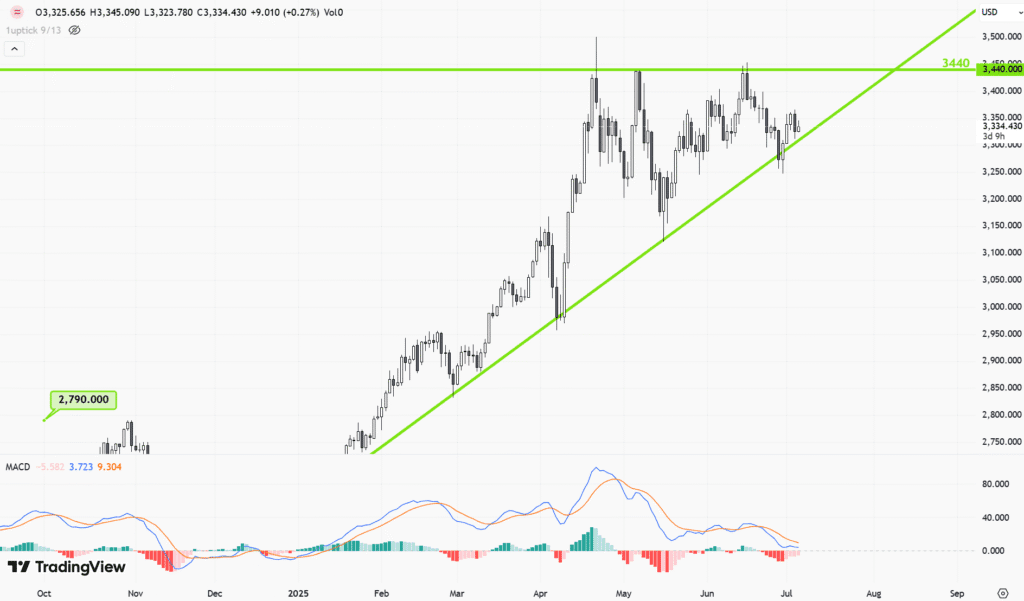
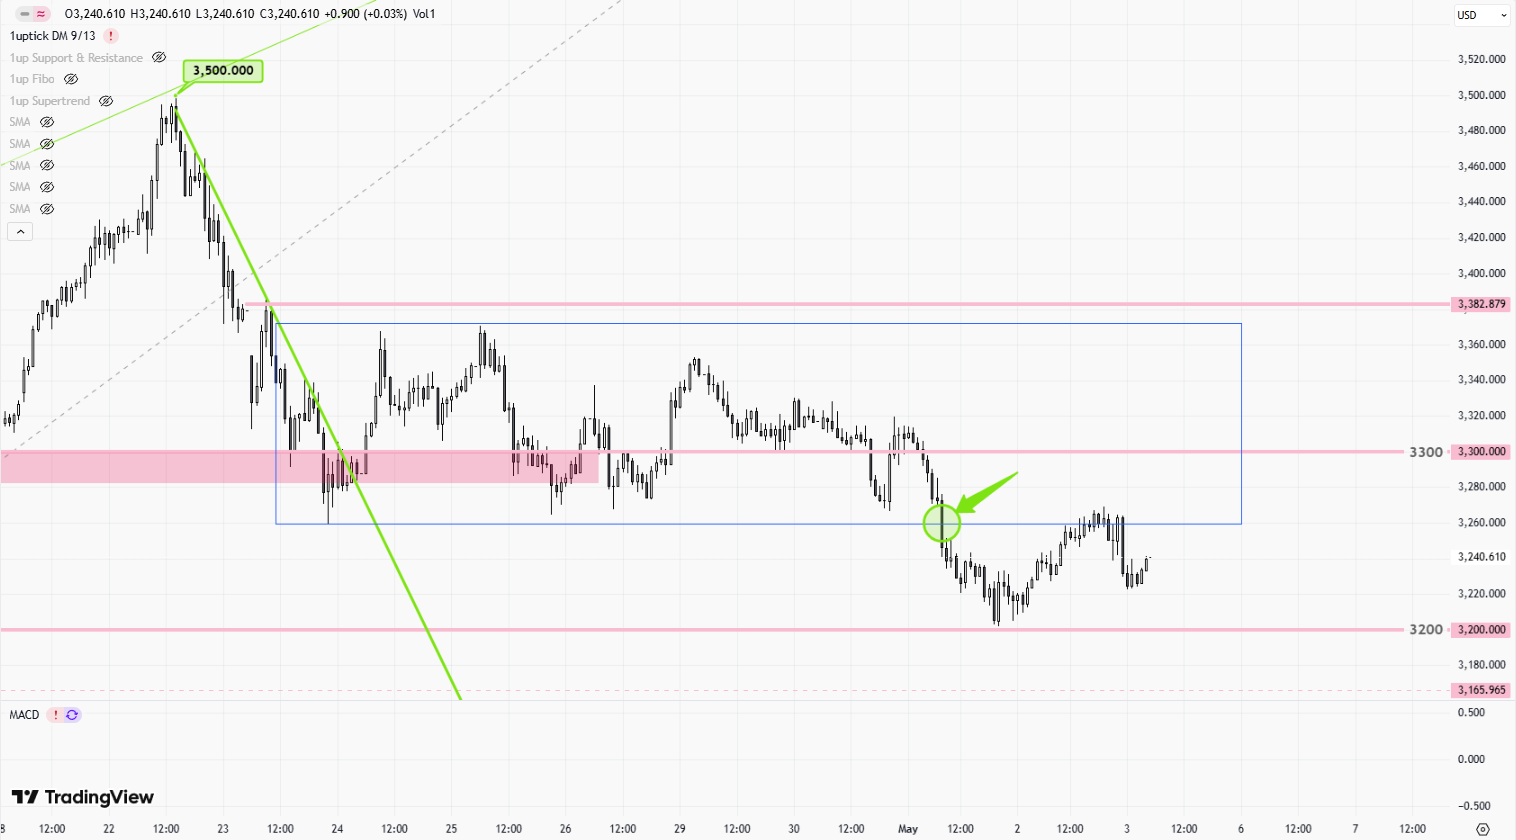
From a technical standpoint, after reaching a record high of $3,500.05, gold has clearly moved into consolidation mode. The short-term support zone lies near $3,200, while resistance is around the $3,300 level. Market momentum is showing signs of slowing, and technical indicators such as the RSI are pulling back from overbought territory, suggesting that gold may need more time to correct and consolidate. If gold holds above the $3,200 mark, there’s still potential for a rebound. If not, a further drop to around $3,150 is possible.
Overall, while short-term fluctuations are being driven by economic data and market sentiment, gold’s long-term fundamentals remain solid. Ongoing geopolitical tensions, continued central bank gold purchases, and room for future Fed rate cuts could all support gold’s role as a hedge. For now, investors are focusing on next week’s Federal Open Market Committee (FOMC) meeting, where any new policy signals will likely shape the next move in gold prices. Watching whether gold can hold above the $3,200 technical level may offer clues for long-side opportunities on pullbacks.
Latest Technical Analysis