 |
| Gold V.1.3.1 signal Telegram Channel (English) |
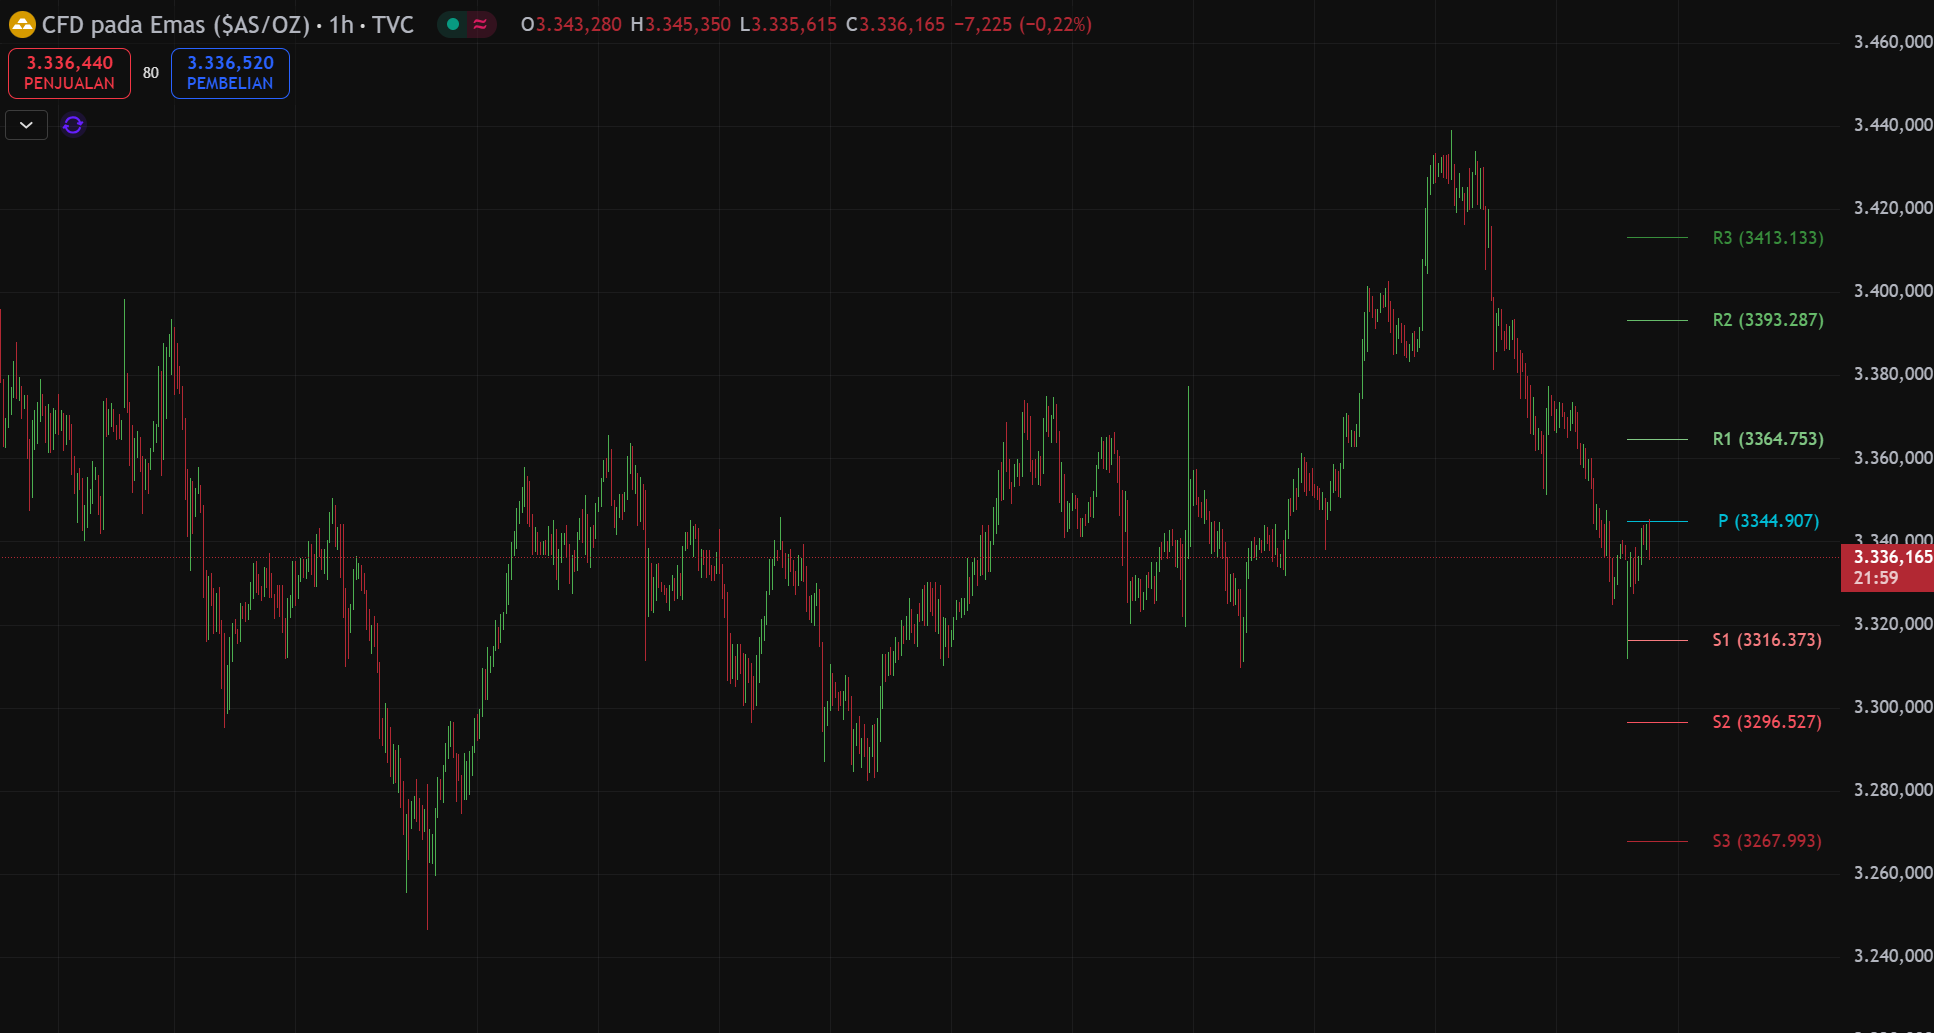
XAUUSD-1 hour
2025-07-28 @ 14:40

Market Overview
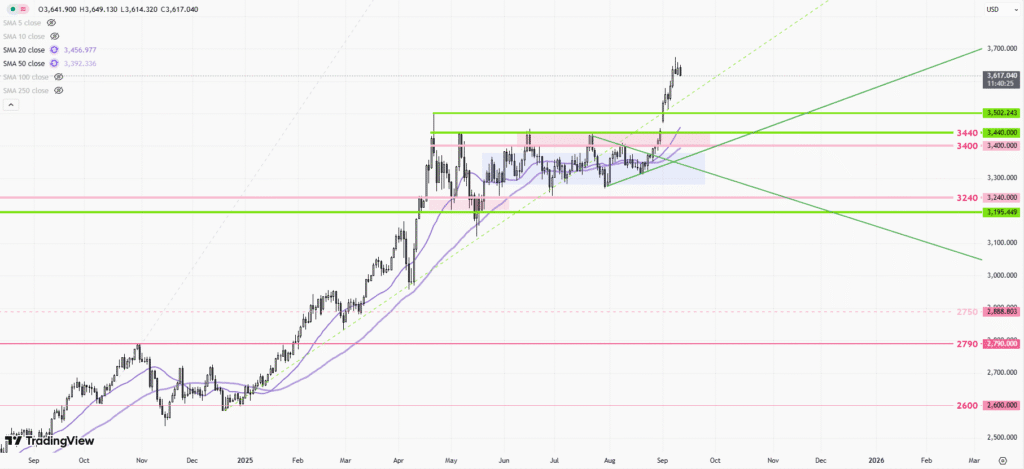
Gold (XAUUSD) experienced notable volatility over the past week, generally slipping below its May trend line at $3,336 and testing key support around $3,285. The recent bearish momentum was intensified by a firm US dollar and weak risk appetite, with a bearish engulfing candle on Wednesday weighing on the outlook. Factors driving gold’s movement included heightened geopolitical tensions in the Middle East, lingering concerns over the US debt situation, and anticipation around upcoming US economic data and rate decisions. Despite some intraday rebounds, gold struggled to maintain bullish momentum, and if the price does not reclaim the $3,340 level, resistance is expected near $3,370 while downside risk remains toward $3,285. The market remains sensitive to developments in US monetary policy and global uncertainty, keeping both upside and downside scenarios in play for gold prices in the short term.
XAUUSD 1-Hour Chart Technical Analysis – July 28, 2025
Technical Indicators
- Moving Averages: The 20-period EMA and 50-period EMA are both sloping downward, with price trading below both. This indicates short-term and mid-term bearish momentum. The 20EMA is nearing a bearish crossover (death cross) with the 200SMA, which often signals deeper medium-term downside risk.
- MACD: The MACD line is below the signal line and the histogram is expanding in the negative zone, reflecting strong bearish momentum and limited chances of a near-term rebound.
- RSI: The Relative Strength Index sits between 30 and 35, signaling that XAUUSD is approaching oversold territory. If the RSI dips below 30, the pair officially enters the oversold zone, which could set up for a technical rebound—but confirmation from pattern breaks or other indicators is required before any reversal can be called.
- ADX: The Average Directional Index is around 40, indicating that the current bearish trend is robust and well-defined.
Prominent Chart Patterns
- There is evidence of a completed short-term double top near 3440, which confirms subsequent downward movement.
- No clear head and shoulders, triangle, or wedge patterns are currently visible.
- Price structure after the double top and breakdown suggests a corrective phase, with minor pause patterns visible (sideways consolidations within the downtrend).
Candlestick Patterns
- Recent candles show several bearish engulfing formations, reinforcing the downward momentum.
- Isolated doji and hammer candles appear in the most recent hourly candles, typically indicating market uncertainty or potential for short-term reversal. However, given the strength of the prevailing downtrend and absence of confirming bullish signals, these alone are insufficient for a major directional shift.
- No major bullish reversal patterns have completed yet.
Trend Direction Assessment
- XAUUSD is currently in a clear downtrend on the 1-hour chart. All major moving averages slope downward, the MACD and RSI confirm bearish conditions, and price is consistently making lower highs and lower lows.
- Any short-term rebounds should be viewed as corrective within the broader bearish context until proven otherwise.
Major Support and Resistance Levels
- Support: The immediate and significant support lies at 3400, which price recently breached. The next band of support is around 3360–3380, where previous consolidations and price reactions occurred on the way up.
- Resistance: The former 3400 level now acts as resistance; above this, a tighter resistance range forms at the 3425–3440 area (the location of the recent double top). Stronger resistance is visible at 3460, which capped upward moves during the last rally.
Other Relevant Insights
- Momentum is firmly to the downside; there is little evidence of exhaustion even as RSI approaches oversold levels.
- Volume data on the candlestick chart is insufficient for deeper analysis, but the absence of high-volume reversals suggests selling pressure remains dominant.
- Short-term rebounds can occur, especially if price enters the oversold zone, but sustainable upward moves require broader structural confirmation—such as a break above the 20EMA and MACD turning positive.
Actionable Technical Outlook
XAUUSD remains in a strong 1-hour downtrend, with all key indicators, price structure, and momentum metrics confirming further downside risk. Short-term relief rallies are possible if deeply oversold conditions trigger profit-taking or short covering, but any recovery is likely to face firm resistance at 3400 and especially at 3425–3440. Tactical traders should trade with the trend, looking for rallies into resistance as potential short entries unless momentum or candle structure clearly shift bullishly. Until a higher low and break above declining moving averages occur, the bearish scenario holds primacy.


